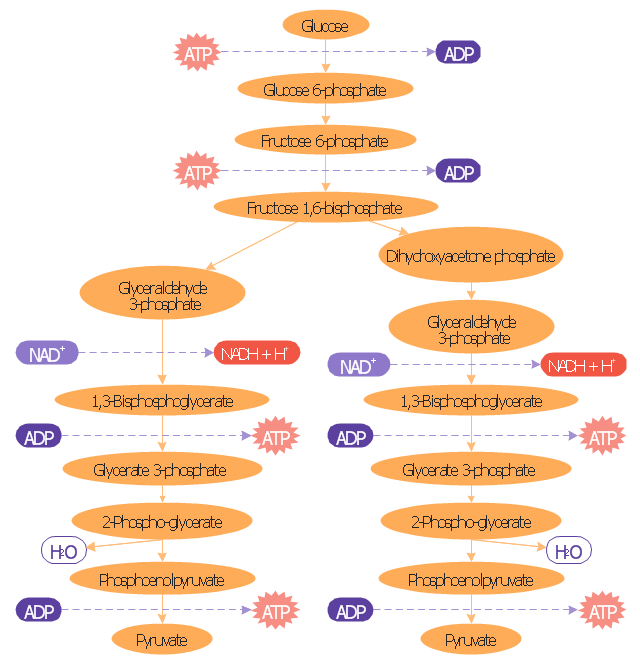
Glycolysis is the metabolic pathway that converts glucose into pyruvate. The free energy released in this process is used to form the high-energy compounds ATP (adenosine triphosphate) and NADH (reduced nicotinamide adenine dinucleotide). [Glycolysis. Wikipedia]
This biochemical diagram was redesigned using ConceptDraw PRO diagramming and vector drawing software from Wikimedia file Glycolysis overview.svg [https:/ / commons.wikimedia.org/ wiki/ File:Glycolysis_ overview.svg].
This biochemistry diagram example is included in the Biology solution from the Science and Education area of ConceptDraw Solution Park. www.conceptdraw.com/ solution-park/ science-education-biology
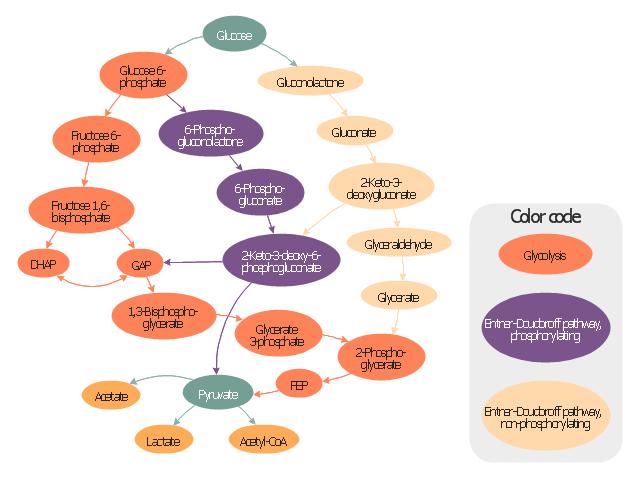
This example of carbohydrates catabolism schematical diagram displays glucose catabolic pathways map.
Organic layout graph having intermediates of glucose catabolism as nodes. Color code: Orange, glycolysis. Green, Entner-Doudoroff pathway, phosphorylating. Yellow, Entner-Doudoroff pathway, non-phosphorylating.
This methabolic pathway map diagram was redesigned using ConceptDraw PRO diagramming and vector drawing software from Commons Wikimedia file Glucose catabolism pathways.svg [https:/ / commons.wikimedia.org/ wiki/ File:Glucose_ catabolism_ pathways.svg ].
This biochemistry diagram example is included in the Biology solution from the Science and Education area of ConceptDraw Solution Park. www.conceptdraw.com/ solution-park/ science-education-biology
- Glycolysis overview diagram | Catabolism schematic | Glucose ...
- Glycolysis overview diagram
- Biochemical metabolic pathway map diagram | Citric acid cycle ...
- Business Diagram Software | Physics | ConceptDraw Arrows10 ...
- Biology | Bio Flowchart Lite | Business Diagram Software |
- Business Diagram Software | Physics | Simple & Fast Diagram ...
- Mathematics | Astronomy | Science and Education Area |
- Biochemical metabolic pathway map diagram | Glucose catabolism ...
- Glucose catabolism pathways map
- Business Diagram Software | Glucose catabolism pathways map ...
- Glucose catabolism pathways map | Catabolism schematic ...
- Conventional energy resources | Resources and energy vector ...
- Flowchart Software | DroidDia prime | Pyramid Diagram |
- Types of Flowchart - Overview | Business Diagram Software | Bio ...
- Glucose catabolism pathways map |
- Physics | Language Learning | Astronomy |
- Network Diagram Examples | Audio and Video Connectors ...
- Biochemical pathway map - Key metabolic processes | Design ...
- Biochemical metabolic pathway map diagram | Catabolism schematic |
- Network Diagram Examples | Cisco Network Design | 3D Network ...

