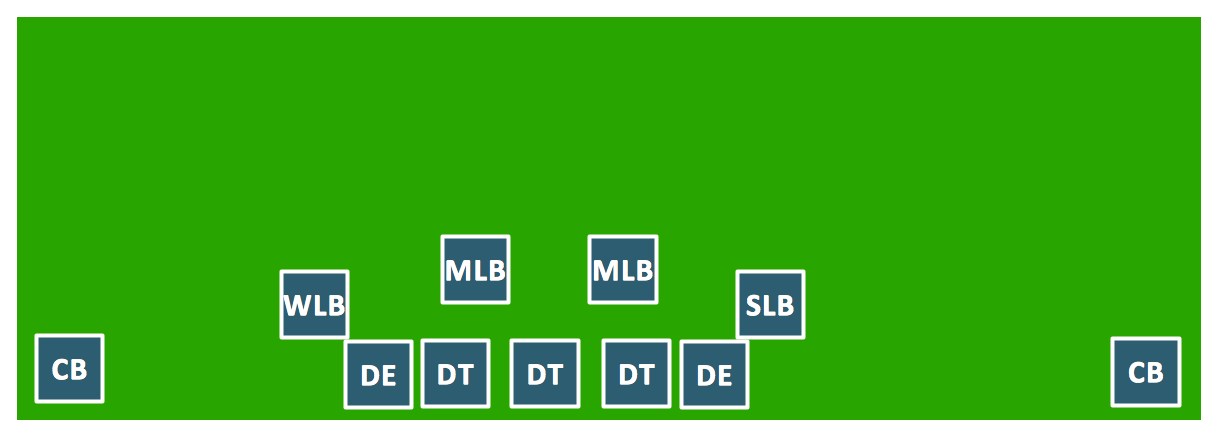
Goal Line Formation (Offense/Defense) Diagram
ConceptDraw DIAGRAM software extended with the Football solution delivers libraries, templates and samples allowing football fans or specialists to draw football-related schemas in minutes. A complete set of predesigned fields and positions make drawing schemas as quickly as possible.The vector stencils library "Management pictograms" contains 72 management pictograms.
Use it to create your management infogram in the ConceptDraw PRO diagramming and vector drawing software.
The flat icons example "Management pictograms - Vector stencils library" is included in the solution "Marketing infographics" from the "Business infographics" area of ConceptDraw Solution Park.
Use it to create your management infogram in the ConceptDraw PRO diagramming and vector drawing software.
The flat icons example "Management pictograms - Vector stencils library" is included in the solution "Marketing infographics" from the "Business infographics" area of ConceptDraw Solution Park.
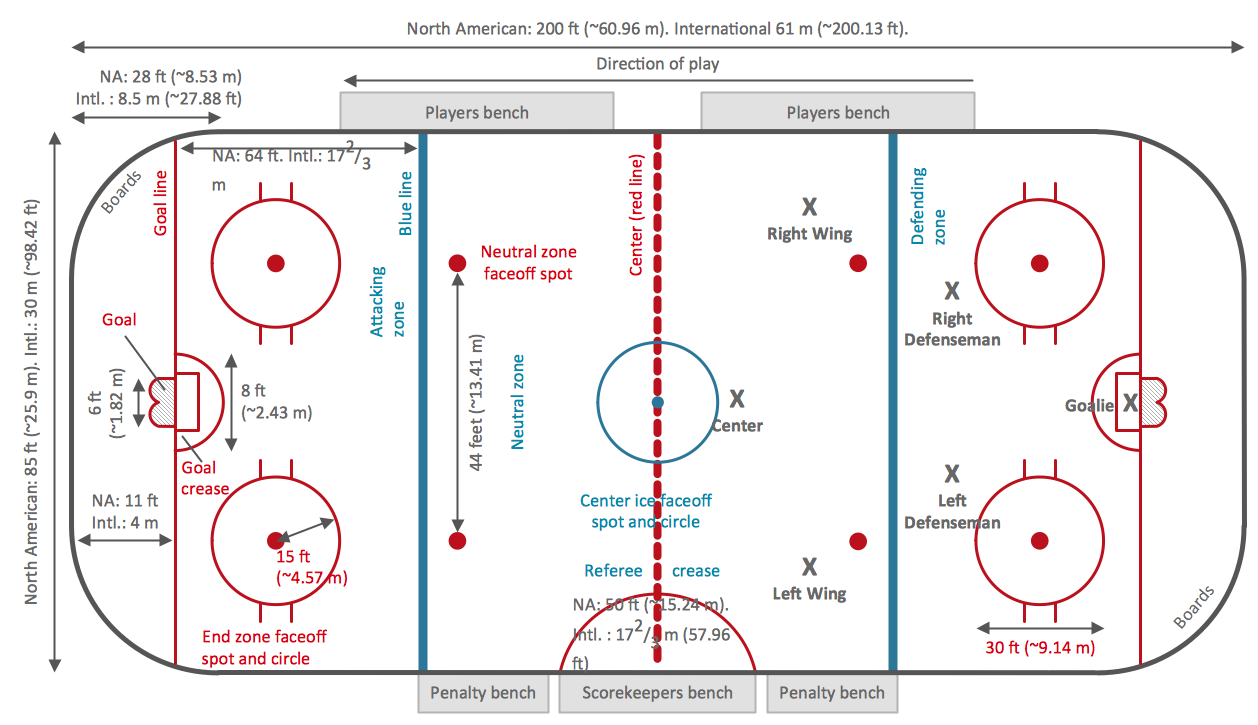
Ice Hockey Rink Dimensions
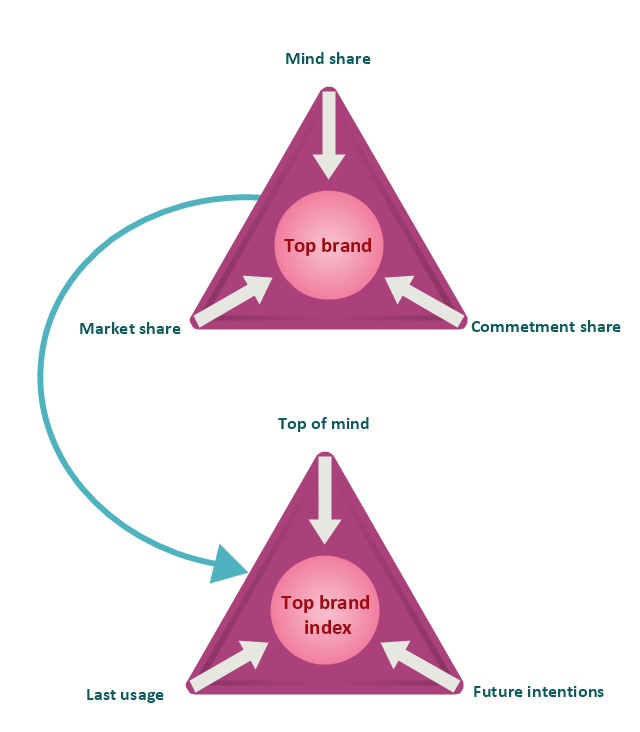
Meeting ice hockey rules one should learn ice hockey rink terms, lines, zones etc. ConceptDraw DIAGRAM is an advanced drawing software that allows you produce ice hockey rink depiction of any complexity, from simple sketch drawing to detailed one as on example below."Brand awareness refers to customers' ability to recall and recognize the brand under different conditions and link to the brand name, logo, jingles and so on to certain associations in memory. It consists of both brand recognition and brand recall. It helps the customers to understand to which product or service category the particular brand belongs and what products and services are sold under the brand name. It also ensures that customers know which of their needs are satisfied by the brand through its products (Keller). Brand awareness is of critical importance since customers will not consider your brand if they are not aware of it. There are various levels of brand awareness that require different levels and combinations of brand recognition and recall. Top-of-Mind is the goal of most companies. Top-of-mind awareness occurs when your brand is what pops into a consumers mind when asked to name brands in a product category." [Brand. Brand awareness. Wikipedia]
This top brand model pyramid diagram was redesigned using the ConceptDraw PRO diagramming and vector drawing software from Wikimedia Commons file Diagram Top Brand Model.jpg. [commons.wikimedia.org/ wiki/ File:Diagram_ Top_ Brand_ Model.jpg]
This file is licensed under the Creative Commons Attribution-Share Alike 3.0 Unported license. [creativecommons.org/ licenses/ by-sa/ 3.0/ deed.en]
The example "Top brand model pyramid diagram" is included in the Pyramid Diagrams solution from the Marketing area of ConceptDraw Solution Park.
Pyramid Chart Examples
Pyramid Charts and Triangle Diagrams are used to visually structure the topics and progressively order the quantitative data. They allow to illustrate hierarchical structure of the topics, proportional, interconnected and containment relations among the topics. The multilevel Pyramids and Triangle diagrams are constructed oriented up or down and divided into several horizontal slices. They are effectively used to represent marketing strategies, social strategies, information systems, market value, etc., to illustrate presentations, websites, documents, reports in business, finances, sales, management, marketing, media, training, consulting, and many other fields. To maximize the efficiency in drawing the Pyramid Charts, use the ConceptDraw DIAGRAM diagramming and vector drawing software extended with Pyramid Diagrams solution from Marketing area, which contains the set of Pyramid Chart examples, samples, templates and vector design elements of triangular diagrams and pyramids with different quantity of levels for various needs.Competitor Analysis
Competitor analysis is a first and obligatory step in elaboration the proper corporate marketing strategy and creating sustainable competitive advantage. Use powerful opportunities of numerous solutions from ConceptDraw Solution Park for designing illustrative diagrams, charts, matrices which are necessary for effective competitor analysis.Soccer (Football) Diagram Software
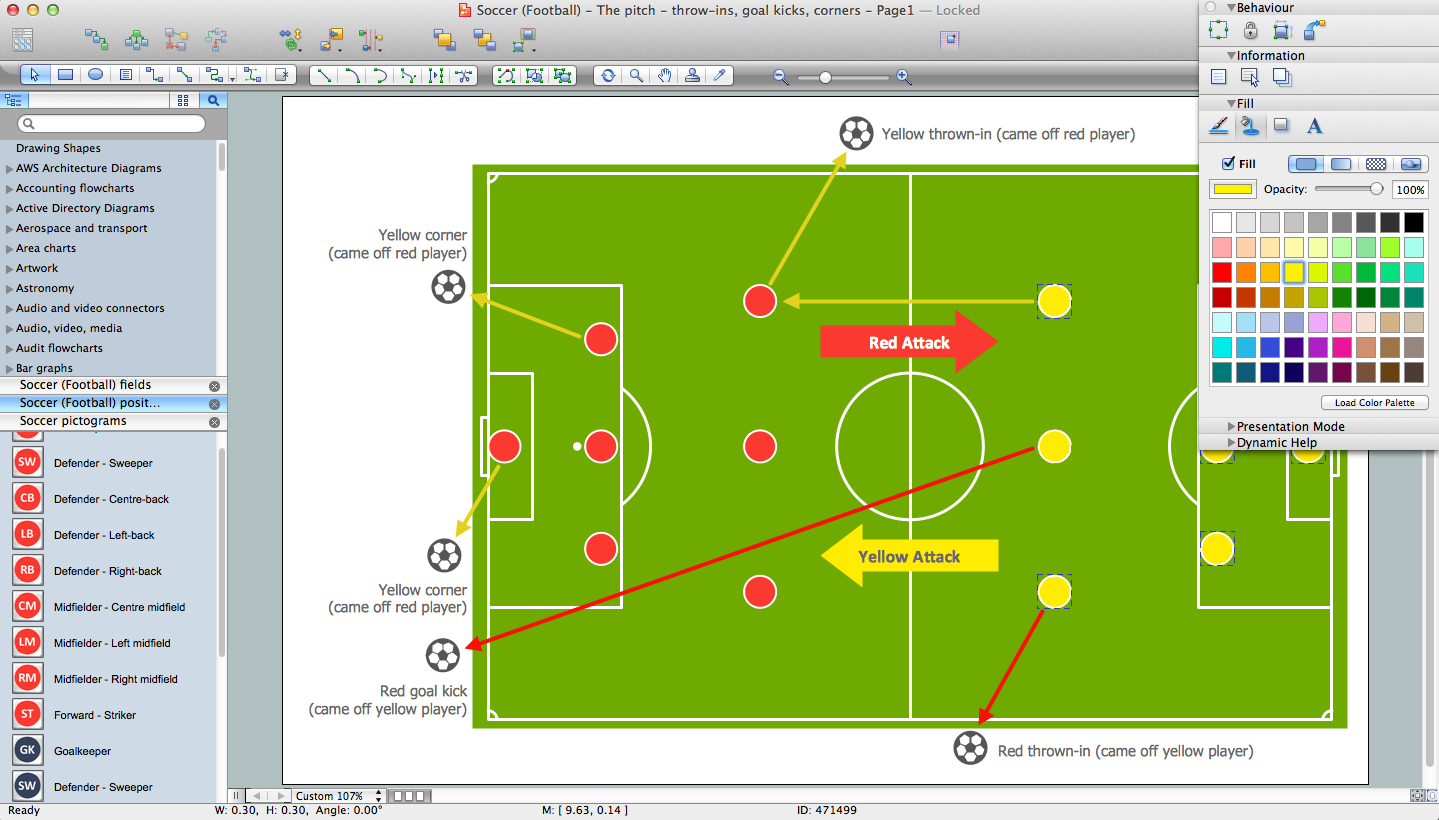
Explaining the soccer strategies and techniques is practically impossible without drawing a diagram. ConceptDraw DIAGRAM diagramming and vector drawing software extended with Soccer solution from the Sport area of ConceptDraw Solution Park is a very convenient and useful tool for designing the soccer-related diagrams.SWOT Template
The SWOT and TOWS Matrix Diagrams solution from the ConceptDraw Solution Park gives a simple visual support for all steps of a SWOT analysis process, which is a popular strategic planning method used to evaluate the Strengths, Weaknesses, as well as Opportunities and Threats facing a project. Strengths are the project's characteristics giving it the advantages over the others, weaknesses are the characteristics placing the team at the disadvantage relatively to others, opportunities are the elements that the project can exploit to its advantage and threats are the elements that can cause the troubles. The results of a correctly performed SWOT analysis help to achieve effectively the main objective. The SWOT templates included to SWOT and TOWS Matrix Diagrams solution for ConceptDraw DIAGRAM isually support the identifying of internal and external factors that are favorable or unfavorable. Making the SWOT analysis and completing the SWOT Matrix by simple filling a SWOT template, you can then export it to large variety of available formats: PowerPoint presentation, PDF, image files, and others.Thе vector stencils library "Football (Soccer)" contains 24 association football (soccer) clipart images.
Use these shapes to draw your association football infographics and illustrations in the ConceptDraw PRO diagramming and vector drawing software extended with the Soccer solution from the Sport area of ConceptDraw Solution Park.
www.conceptdraw.com/ solution-park/ sport-soccer
Use these shapes to draw your association football infographics and illustrations in the ConceptDraw PRO diagramming and vector drawing software extended with the Soccer solution from the Sport area of ConceptDraw Solution Park.
www.conceptdraw.com/ solution-park/ sport-soccer
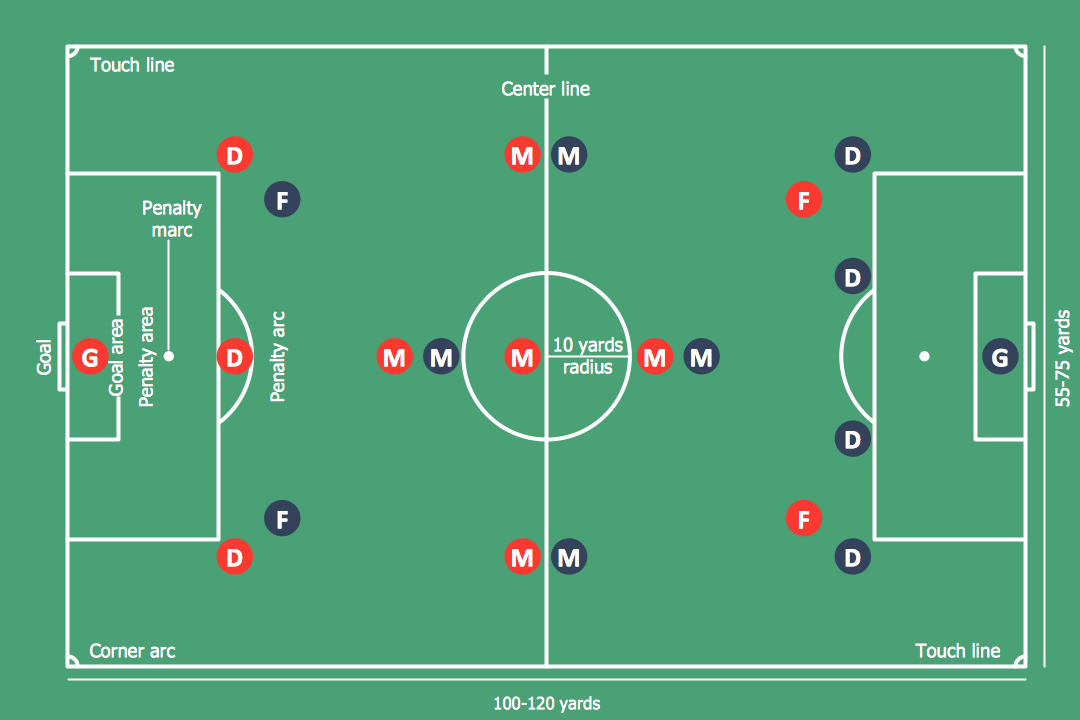
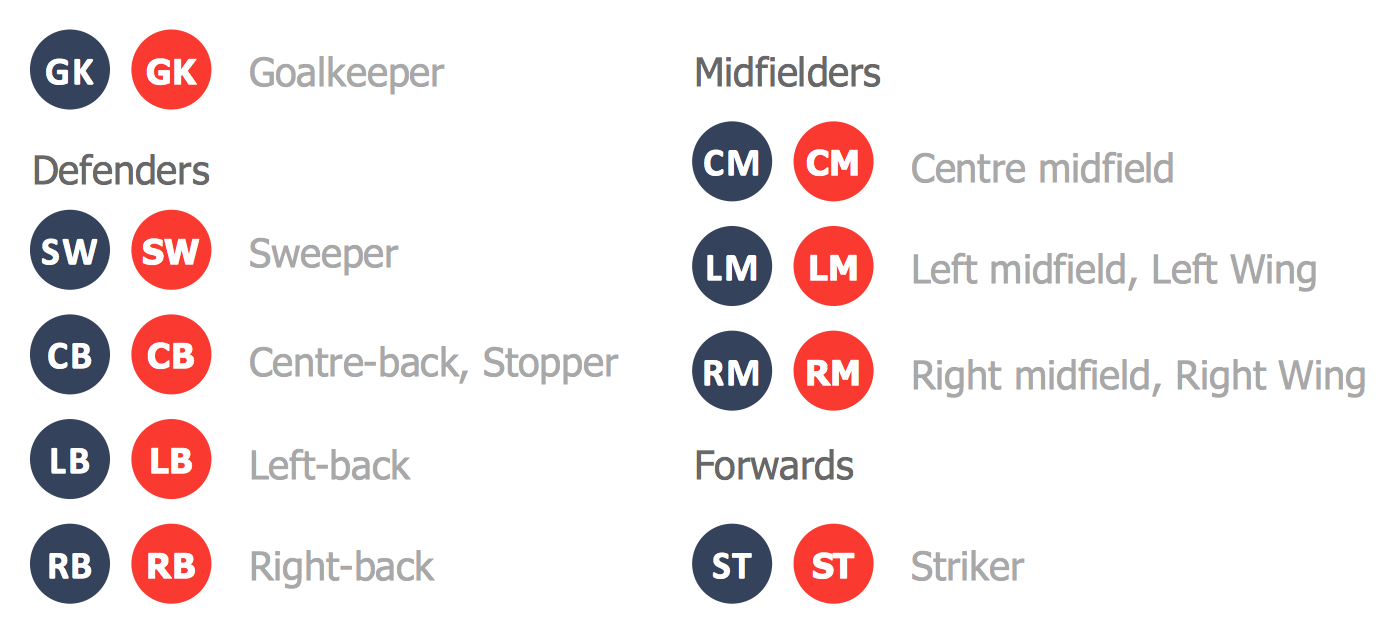
Soccer (Football) Positions
Explaining soccer positions becomes much more easier and time saving with visual drawings. ConceptDraw DIAGRAM software extended with the Soccer solution from the Sport area of ConceptDraw Solution Park is very useful tool that will help you design the soccer-related drawings of any complexity in minutes.Create Soccer (Football) Positions
Explaining the soccer techniques and rules becomes much more easier and time saving with illustrations. The Soccer solution from the Sport area of ConceptDraw Solution Park provides the libraries, templates and samples that will help you produce the soccer illustrations of any complexity in minutes.Gane Sarson Diagram
The Gane-Sarson methodology uses the graphical techniques for building the logical models for the systems. It is helpful for analysts and designers to make common and clear picture of the system, to depict all its processes and how they transform the data. The Gane-Sarson methodology lets represent all this information in a way understandable for the users and other interested people, and gives the possibility to see instantly how the system's parts serve together to meet their needs. This methodology supposes the building of a system top-down. First you need create an overall system data flow, then determine the details of the data structures, the process logic and design the modular structures. ConceptDraw DIAGRAM diagramming and vector drawing software offers the Data Flow Diagrams solution with Gane-Sarson Notation library rich for the specific symbols of the Gane-Sarson notation. All they are vector and fully ready-to-use for drawing the Data Flow Diagrams, which will be then successfully used in presentations, websites, and various business documents.Organizational Structure Types
There are three main types of organizational structures which can be adopted by organizations depending on their objectives: functional structure, divisional structure, matrix structure. ConceptDraw DIAGRAM diagramming and vector drawing software enhanced with 25 Typical Orgcharts solution from the Management area of ConceptDraw Solution Park is ideal for designing diagrams and charts of any organizational structure types.Agile Methodology
Agile methodology is an excellent alternative to waterfall and traditional sequential development. ConceptDraw DIAGRAM software extended with SCRUM Workflow solution is ideal for quick and easy designing various diagrams, charts, mind maps and schematics illustrating software development using Agile methodologies, and in particular Scrum methodology.Stakeholder Onion Diagrams
The Stakeholder Onion Diagram is a popular and widely used way to view the relationships of stakeholders to a project goal. The Onion Diagram focuses on the project goal, most of other diagram styles focus on the project, stakeholders, and timeline. This difference favorably distinguishes and separates the Onion Diagram from other types of diagrams. Design fast and easy Stakeholder Onion Diagrams of any complexity in ConceptDraw DIAGRAM diagramming and vector drawing software using the powerful tools of Stakeholder Onion Diagrams Solution from the Management Area of ConceptDraw Solution Park.- Logo Onion
- Objectives Logo Clip Art
- Football Ball Logo Png
- Football Player Logo Png
- Shirt Logo
- Association football (soccer) - The pitch: throw-ins, goal kicks, corners
- Technical Competencies Logo Png
- Soccer Logo Goalkeeper
- Arrow Logo Clipart
- Soccer Referee Logo
- Investment Logo Png Vector
- Football Fan Logo Png
- Soccer Player Logo Png
- I Formation (Offense) Diagram | Soccer (Football) Formation | Goal ...
- Defensive Strategy Diagram – 46 Defence | Goal Line Formation ...
- Soccer (Football) Illustrated | Goal Line Formation (Offense/Defense ...
- Goal Line Formation (Offense/Defense) Diagram | Football ...
- Soccer (Football) Formation | Football | Goal Line Formation ...
- The Referees Logos
- Investment Vector Logo





---vector-stencils-library.png--diagram-flowchart-example.png)
---vector-stencils-library.png--diagram-flowchart-example.png)
---vector-stencils-library.png--diagram-flowchart-example.png)
---vector-stencils-library.png--diagram-flowchart-example.png)
---vector-stencils-library.png--diagram-flowchart-example.png)
---vector-stencils-library.png--diagram-flowchart-example.png)
---vector-stencils-library.png--diagram-flowchart-example.png)
---vector-stencils-library.png--diagram-flowchart-example.png)
---vector-stencils-library.png--diagram-flowchart-example.png)
---vector-stencils-library.png--diagram-flowchart-example.png)
---vector-stencils-library.png--diagram-flowchart-example.png)
---vector-stencils-library.png--diagram-flowchart-example.png)
---vector-stencils-library.png--diagram-flowchart-example.png)
---vector-stencils-library.png--diagram-flowchart-example.png)
---vector-stencils-library.png--diagram-flowchart-example.png)
---vector-stencils-library.png--diagram-flowchart-example.png)
---vector-stencils-library.png--diagram-flowchart-example.png)
---vector-stencils-library.png--diagram-flowchart-example.png)
---vector-stencils-library.png--diagram-flowchart-example.png)
-football-(soccer)---vector-stencils-library.png--diagram-flowchart-example.png)
-football-(soccer)---vector-stencils-library.png--diagram-flowchart-example.png)
-football-(soccer)---vector-stencils-library.png--diagram-flowchart-example.png)
-football-(soccer)---vector-stencils-library.png--diagram-flowchart-example.png)
---vector-stencils-library.png--diagram-flowchart-example.png)
