 Google Cloud Platform
Google Cloud Platform solution extends the ConceptDraw DIAGRAM functionality with extensive collection of drawing tools, ready-made samples and professionally designed specific Google Cloud Platform icons, allowing effectively design Google Cloud Platform (GCP) architectural diagrams, Google Cloud Platform drawings, GCP schematics of different complexity, and to illustrate on them the work of Google Cloud Platform (GCP), best features of GCP, its services, solutions and products, and the ways of their use.
HelpDesk
How to Create a Google Cloud Platform Architecture Diagram

 Cross-Functional Flowcharts
Cross-functional flowcharts are powerful and useful tool for visualizing and analyzing complex business processes which requires involvement of multiple people, teams or even departments. They let clearly represent a sequence of the process steps, the order of operations, relationships between processes and responsible functional units (such as departments or positions).
Data Flow Diagram Symbols. DFD Library

 AWS Architecture Diagrams
AWS Architecture Diagrams with powerful drawing tools and numerous predesigned Amazon icons and AWS simple icons is the best for creation the AWS Architecture Diagrams, describing the use of Amazon Web Services or Amazon Cloud Services, their application for development and implementation the systems running on the AWS infrastructure. The multifarious samples give you the good understanding of AWS platform, its structure, services, resources and features, wide opportunities, advantages and benefits from their use; solution’s templates are essential and helpful when designing, description and implementing the AWS infrastructure-based systems. Use them in technical documentation, advertising and marketing materials, in specifications, presentation slides, whitepapers, datasheets, posters, etc.
 IDEF0 Diagrams
IDEF0 Diagrams visualize system models using the Integration Definition for Function Modeling (IDEF) methodology. Use them for analysis, development and integration of information and software systems, and business process modelling.
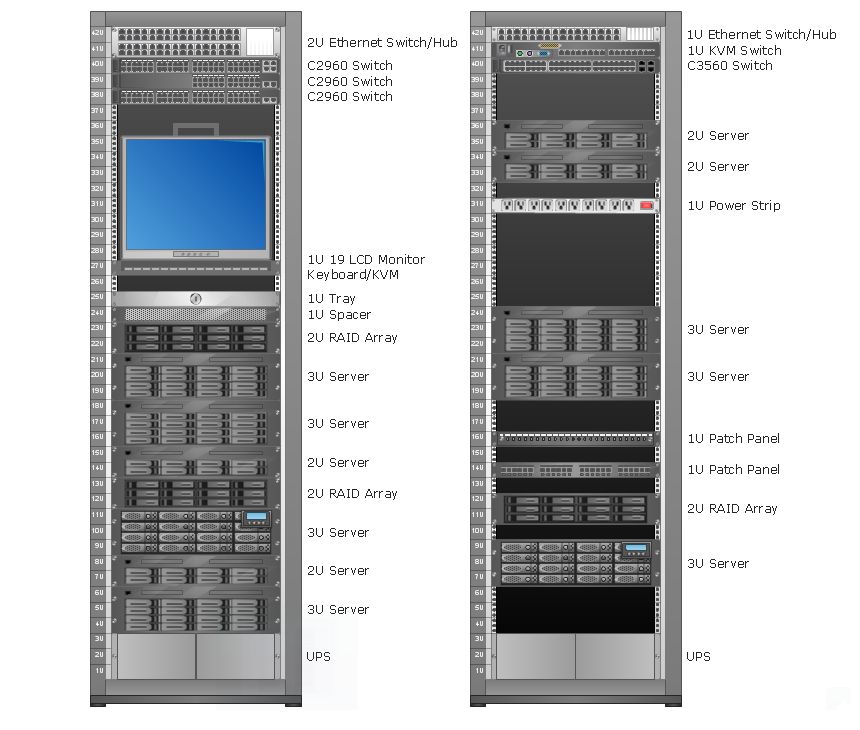
Rack Diagrams

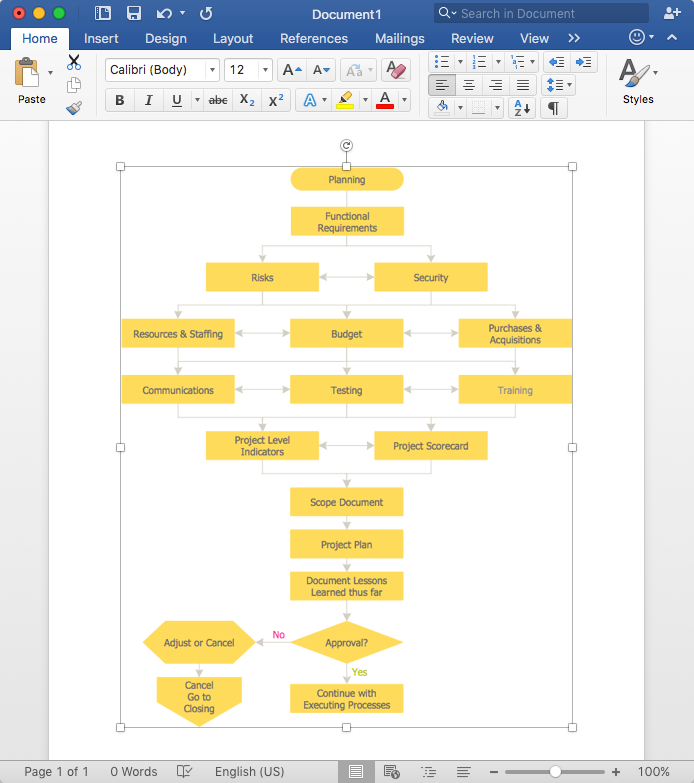
HelpDesk
How to Add a Flowchart to MS Word Document
- Fishbone Diagrams | Google Cloud Platform | Workflow Diagrams Of ...
- Best Solution to Diagram Google Cloud Platform Architecture
- Fishbone Diagrams | Workflow Diagrams | Google Cloud Platform ...
- Fishbone Diagrams | Google Cloud Platform | Circle-Spoke ...
- Business Process Management | Google Cloud Platform | Process ...
- Software Engineer Package | Scrum Workflow | Google Cloud ...
- Best Program to Make Workflow Diagrams | Data Modeling with ...
- How to Create a Google Cloud Platform Architecture Diagram | Cms ...
- Basic Flowchart Symbols and Meaning | Google Cloud Platform ...
- Block diagram - Document management system architecture | AWS ...