Bar Diagrams for Problem Solving. Create business management bar charts with Bar Graphs Solution
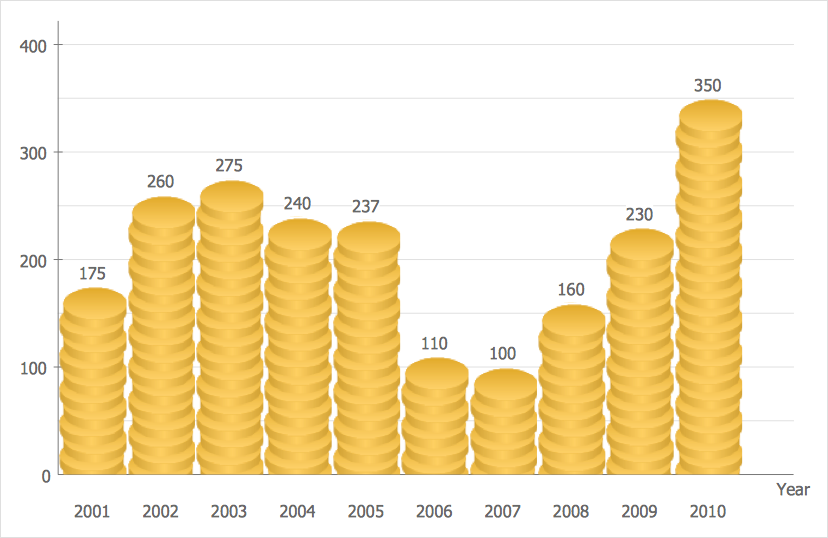
Create bar charts for business management problem solving and data comparison using the ConceptDraw PRO diagramming and vector drawing software extended with the Bar Graphs Solution from the Graphs and Charts area of ConceptDraw Solition Park.Sales Growth. Bar Graphs Example
This sample was created in ConceptDraw PRO diagramming and vector drawing software using the Bar Graphs Solution from Graphs and Charts area of ConceptDraw Solution Park. It is Bar Graphs example, Sales Growth example, Column Chart Example - Sales Report.TQM Diagram Example
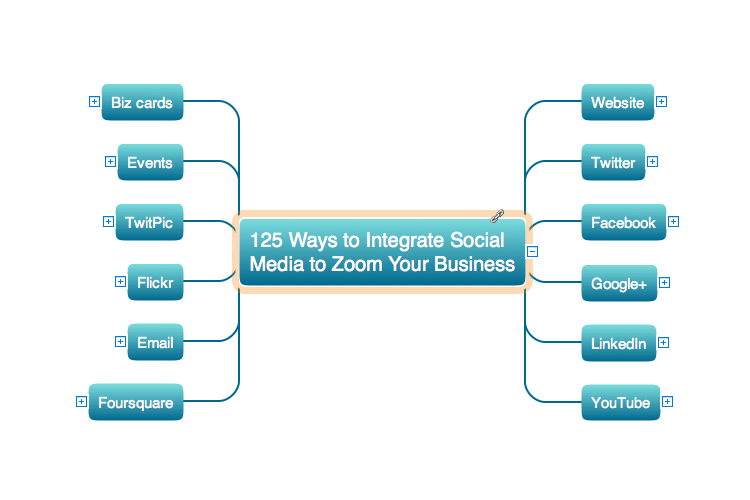
The Total Quality Management Diagram solution helps you and your organization visualize business and industrial processes. Create Total Quality Management diagrams for business process with ConceptDraw software.
 Bar Graphs
The Bar Graphs solution enhances ConceptDraw PRO v10 functionality with templates, numerous professional-looking samples, and a library of vector stencils for drawing different types of Bar Graphs, such as Simple Bar Graph, Double Bar Graph, Divided Bar Graph, Horizontal Bar Graph, Vertical Bar Graph, and Column Bar Chart.
 Line Graphs
How to draw a Line Graph with ease? The Line Graphs solution extends the capabilities of ConceptDraw PRO v10 with professionally designed templates, samples, and a library of vector stencils for drawing perfect Line Graphs.
HelpDesk
How to Create a Picture Graph
Picture Graphs are used commonly to represent non-complex data to a large audience. A Picture Graph is simple kind of marketing diagram used to show the relationship among various quantities. It include pictures or symbols to represent information visually. There are many cases when you have just some numbers to show and compare. This is not a reason to not use visual tools. You can produce a simple picture graph using memorable symbols to get the best visual presentation. Using specific symbols instead of regular colored bars makes picture graphs a much more descriptive tool. You can use tools from an existing library or find appropriate clipart in ConceptDraw’s collection. ConceptDraw PRO allows you to draw a simple and easy to understand Graph Charts using the special library.
 Picture Graphs
Typically, a Picture Graph has very broad usage. They many times used successfully in marketing, management, and manufacturing. The Picture Graphs Solution extends the capabilities of ConceptDraw PRO v10 with templates, samples, and a library of professionally developed vector stencils for designing Picture Graphs.
Identifying Quality Management System
The Total Quality Management Diagram solution helps your organization visualize business and industrial processes. Create Total Quality Management diagrams for business process with ConceptDraw software.Process Flowchart
The main reason of using Process Flowchart or PFD is to show relations between major parts of the system. Process Flowcharts are used in process engineering and chemical industry where there is a requirement of depicting relationships between major components only and not include minor parts. Process Flowcharts for single unit or multiple units differ in their structure and implementation. ConceptDraw PRO is Professional business process mapping software for making Process flowcharts, Process flow diagram, Workflow diagram, flowcharts and technical illustrations for business documents and also comprehensive visio for mac application. Easier define and document basic work and data flows, financial, production and quality management processes to increase efficiency of your business with ConcepDraw PRO. Business process mapping software with Flowchart Maker ConceptDraw PRO includes extensive drawing tools, rich examples and templates, process flowchart symbols and shape libraries, smart connectors that allow you create the flowcharts of complex processes, process flow diagrams, procedures and information exchange. Process Flowchart Solution is project management workflow tools which is part ConceptDraw Project marketing project management software. Drawing charts, diagrams, and network layouts has long been the monopoly of Microsoft Visio, making Mac users to struggle when needing such visio alternative like visio for mac, it requires only to view features, make a minor edit to, or print a diagram or chart. Thankfully to MS Visio alternative like ConceptDraw PRO software, this is cross-platform charting and business process management tool, now visio alternative for making sort of visio diagram is not a problem anymore however many people still name it business process visio tools.
Visual Presentations Made Easy with Diagramming Software
Automatically create a presentation-quality diagram in one click with ConceptDraw PRO.
Bubble diagrams in Landscape Design with ConceptDraw PRO
Bubble Diagrams are the charts with a bubble presentation of data with obligatory consideration of bubble's sizes. They are analogs of Mind Maps and find their application at many fields, and even in landscape design. At this case the bubbles are applied to illustrate the arrangement of different areas of future landscape design, such as lawns, flowerbeds, playgrounds, pools, recreation areas, etc. Bubble Diagram helps to see instantly the whole project, it is easy for design and quite informative, in most cases it reflects all needed information. Often Bubble Diagram is used as a draft for the future landscape project, on the first stage of its design, and in case of approval of chosen design concept is created advanced detailed landscape plan with specification of plants and used materials. Creation of Bubble Diagrams for landscape in ConceptDraw PRO software is an easy task thanks to the Bubble Diagrams solution from "Diagrams" area. You can use the ready scanned location plan as the base or create it easy using the special ConceptDraw libraries and templates.eLearning for Leadership
Digital Learning Tools & Technologies. Online training with Skype for effective classrooms. Changing perceptions of leadership and learning.
HelpDesk
How to Draw a Line Chart Quickly
A common line chart is a graphical representation of the functional relationship between two series of data. A line chart that is created by connecting a series of data points together with a straight line is the most basic type of a line chart. A line chart can be used for depicting data that changes continuously over time. It is extensively utilized in statistics, marketing and financial business. ConceptDraw Line Graph solution provides the possibility to make 2D line charts quickly and effortlessly.TQM Diagram Tool
The Total Quality Management Diagram solution helps you and your organization visualize business and industrial processes. Create Total Quality Management diagrams for business process with ConceptDraw software.HelpDesk
How to Draw a Scatter Diagram Using ConceptDraw PRO
Scatter Diagrams are used to visualize how a change in one variable affects another. A Scatter Diagram displays the data as a set of points in a coordinate system. It combines these values into single data points and displays them in uneven intervals. A Scatter Diagram can be very useful to for identifying relationships between variables, for example the relationship of price and quality rating. Making a Scatter Diagram involves many different elements that can be managed using ConceptDraw Scatter Diagram solution.- Tqm Graphs
- Graphs Of Tqm
- Tqm Graph Illustration
- Images Of Graphs Showing Total Quality Management
- Sales Growth. Bar Graphs Example | TQM Diagram Example ...
- Office Layout Plans | Wht Is Graph Tool Of Tqm
- Graphs Diagrams And Pictures That Can Show Tqm Clearly
- Draw The Tqm Graphs
- Plumbing and Piping Plans | Total Quality Management TQM ...
- Charts And Graphs Tqm
- Sales Growth. Bar Graphs Example | TQM Diagram Tool | Sales ...
- Mathematics | Venn Diagrams | Bar Graphs | Disaster Management ...
- Function Of Total Quality Management Graph
- Quality Control Chart Software — ISO Flowcharting | Bar Graphs ...
- Quality Control Chart Software — ISO Flowcharting | TQM Diagram ...
- Scatter Diagram In Tqm
- Line Graph Charting Software | Pie Chart Software | Spider Chart ...
- Manufacturing Quality Graphs
- Total Quality Management Value | TQM Diagram Tool | Total Quality ...
- Total Quality Management TQM Diagrams | Site Plans | How To ...


