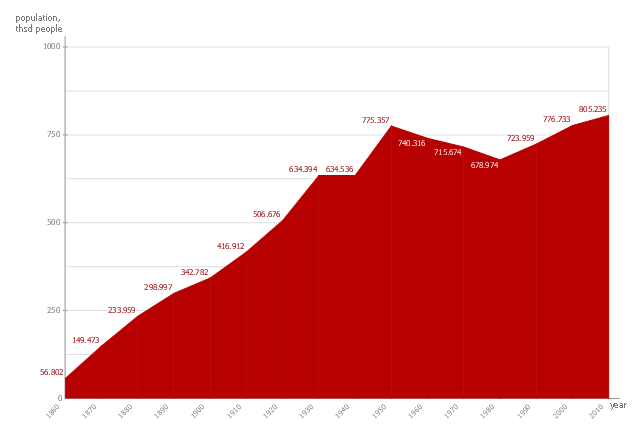
This area chart sample shows the San Francisco population changes from 1860 to 2010.
"San Francisco ..., officially the City and County of San Francisco, is the leading financial and cultural center of Northern California and the San Francisco Bay Area.
The only consolidated city-county in California, San Francisco encompasses a land area of about 46.9 square miles (121 km2) on the northern end of the San Francisco Peninsula, giving it a density of about 17,620 people per square mile (6,803 people per km2). It is the most densely settled large city (population greater than 200,000) in the state of California and the second-most densely populated major city in the United States after New York City. San Francisco is the fourth most populous city in California, after Los Angeles, San Diego and San Jose, and the 14th most populous city in the United States—with a Census-estimated 2012 population of 825,863. The city is also the financial and cultural hub of the larger San Jose-San Francisco-Oakland metropolitan area, with a population of 8.4 million." [San Francisco. Wikipedia]
The area graph example "San Francisco population history" was created using the ConceptDraw PRO diagramming and vector drawing software extended with the Area Charts solution from the Graphs and Charts area of ConceptDraw Solution Park.
Area chart
Pictures of Graphs

What Is a Picture Graph?

What Is a Line Chart

Competitor Analysis

Geo Map — USA — Montana

Sample Pictorial Chart. Sample Infographics

 Circle-Spoke Diagrams
Examples of subject areas that are well suited to this approach are marketing, business, products promotion, process modeling, market, resource, time, and cost analysis. Circle-Spoke Diagrams are successfully used in presentations, conferences, management documents, magazines, reportages, reviews, reports, TV, and social media.
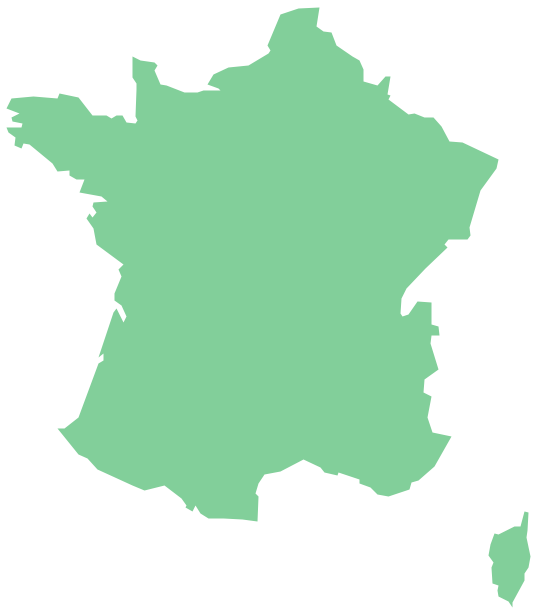
Geo Map — Europe — France
ERD Symbols and Meanings


Infographic Maker

Basic Diagramming


Seven Basic Tools of Quality — Quality Control

 USA Maps
Use the USA Maps solution to create a map of USA, a US interstate map, printable US maps, US maps with cities and US maps with capitals. Create a complete USA states map.
- Line Graph Of Big Population
- World Population Chart Drawing
- Picture Graph | Picture Graphs | How to Create a Picture Graph in ...
- Population growth by continent | Line Graph | Line Chart Examples ...
- Images Of Best Graph Of Population
- Line Graph For Population Growth
- Basic Diagramming | Area Chart | Line Chart Examples | Population ...
- Line Chart Examples | Line Graph | Pictures of Graphs | Population ...
- Sample Chart Of Population
- Basic Diagramming | Line Chart Examples | Line Graph | Population ...
- Line Chart Examples | Population growth by continent | San ...
- Picture Graphs | Picture Graph | How to Create a Picture Graph in ...
- An Easy Diagram Of Population
- Images On World Population For Chart Making
- US Census Population Graph from 1790 | San Francisco population ...
- San Francisco population history | Picture Graphs | Barrie population ...
- Population Education Pictures Chart Making
- Area Chart San Francisco Population History
- Geo Map - Asia | Pictures of Graphs | Picture Graph | World ...
- Flow Chart On Population Explosion