Visual Presentations Made Easy with Diagramming Software
Automatically create a presentation-quality diagram in one click with ConceptDraw PRO.
The Best Drawing Program for Mac
ConceptDraw PRO is the professional business graphic software for drawing diagrams and charts with great visual appeal on Mac OS X.Basic Diagramming
Create flowcharts, organizational charts, bar charts, line graphs, and more with ConceptDraw PRO.
Simple Drawing Applications for Mac
ConceptDraw gives the ability to draw simple diagrams like flowcharts, block diagrams, bar charts, histograms, pie charts, divided bar diagrams, line graphs, area charts, scatter plots, circular arrows diagrams, Venn diagrams, bubble diagrams, concept maps, and others.Simple Diagramming
Create flowcharts, org charts, floor plans, business diagrams and more with ConceptDraw PRO.
Basic Diagramming
Mathematics is an exact science, which studies the values, spatial forms and quantitative relations. It is a science, in which is built large number of various diagrams, charts and graphs that present the material in a clear, visual and colorful form, help to analyze the information and to make certain conclusions. A diagram is a graphical representation of data using the linear segments or geometric shapes, which allows to evaluate the ratio of several values. Depending on the types of solved tasks are used the diagrams of different kinds. A graph is a diagram that shows quantitative dependencies of various processes using the curves. ConceptDraw PRO is a powerful intelligent and multifunctional vector engine for drawing different Mathematical diagrams and graphs, Mathematical illustrations, complex and simple Diagram mathematics, Flowcharts of equation solving process, Line graphs, Scatter plots, Histograms, Block diagrams, Bar charts, Divided bar diagrams, Pie charts, Area charts, Circular arrows diagrams, Venn diagrams, Bubble diagrams, Concept maps, and many others.
 Marketing Diagrams
This solution extends ConceptDraw PRO with samples, templates and library of design elements for drawing the marketing diagrams.
Basic Diagramming
Try ConceptDraw program, the perfect drawing tool for creating all kinds of great-looking drawings, charts, graphs, and illustrations.
Best Diagramming
Need to draw a diagram, process chart, flowchart, organizational chart, graphic design? ConceptDraw can help you to make professional graphic documents quickly.
 Marketing
This solution extends ConceptDraw PRO v9 and ConceptDraw MINDMAP v7 with Marketing Diagrams and Mind Maps (brainstorming, preparing and holding meetings and presentations, sales calls).
 Graphs and Charts Area
Solutions from the Graphs and Charts Area of ConceptDraw Solution Park collect templates, samples and libraries of vector stencils for visualization of numerical data.
A KPI Dashboard Provides the Answers Your Sales Team
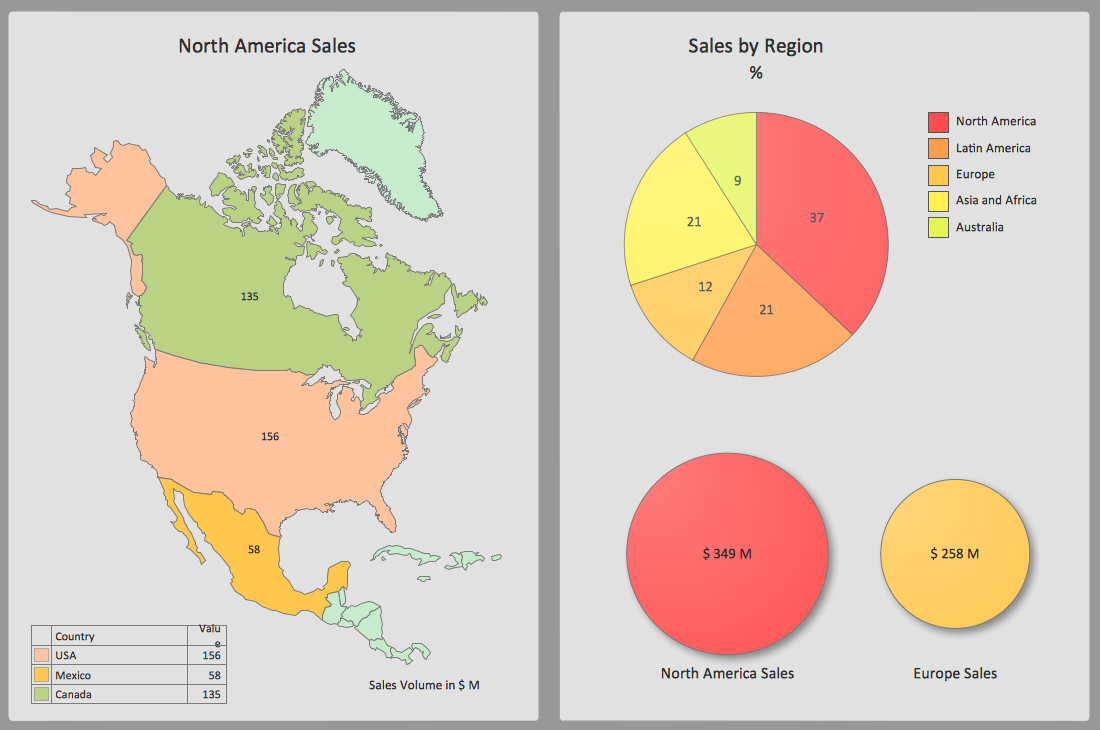
Sales dashboard is a tool that provides the answers to all questions your sales team may have. A mature sales dashboard provides complete set of KPI to shows corporate, team or personal performance to keep sales process clear.
 PM Presentations
This solution extends ConceptDraw MINDMAP and ConceptDraw PRO software, improving the efficiency of the project management process by using the same source data to build targeted presentations.
Sales Dashboard Examples
Visualizing sales data you may need a good example to start. ConceptDraw Sales Dashboard solution delivers a complete set of templates and samples you can use as examples to start composing your own sales dashboard.Best Vector Drawing Application for Mac OS X
ConceptDraw PRO creates drawings, diagrams and charts with great visual appeal in Mac OS X.- Line Graph Charting Software | Scatter Chart Examples | Visual ...
- SWOT analysis matrix - Template | Business Productivity Area ...
- Picture graph template | Business and Finance Illustrations ...
- Line graph template
- Line Graph Charting Software | Line Chart Examples | Line graph ...
- Line Graphs | Line Graph Charting Software | Line graph template |
- Timeline Diagrams | Line Chart Examples | Line Graph Charting ...
- SWOT Sample in Computers | One formula of professional mind ...
- Picture graph template | Basic Diagramming | The Best Drawing ...
- Design elements - Picture graphs | Bar Chart Software | Column ...
- SWOT analysis Software & Template for Macintosh and Windows ...
- Illustration | Basic Diagramming | Presentation Clipart |
- Best Program to Make Diagrams | Basic Diagramming | Visual ...
- Marketing | Feature comparison chart - Digital scouting cameras ...
- Create Graphs and Charts | The Best Drawing Program for Mac ...
- Picture Graphs | Picture graph template | Design elements - Picture ...
- Marketing | Fishbone Diagram | SWOT analysis Software ...
- Scatter Chart Examples | How to Create a Scatter Chart | Scatter ...
- Scatter Chart Examples | Line Chart Examples | Correlation ...
- Double bar graph template


