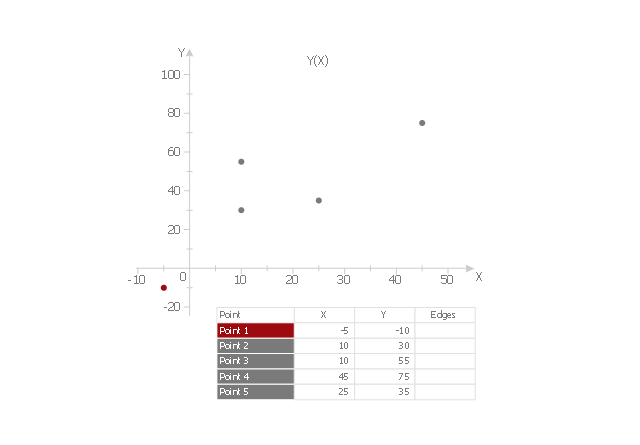
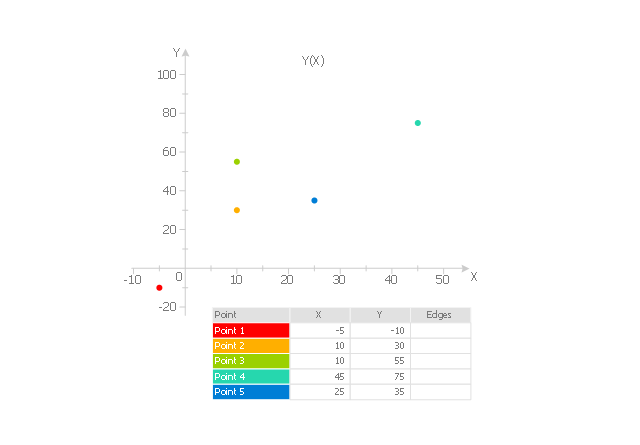
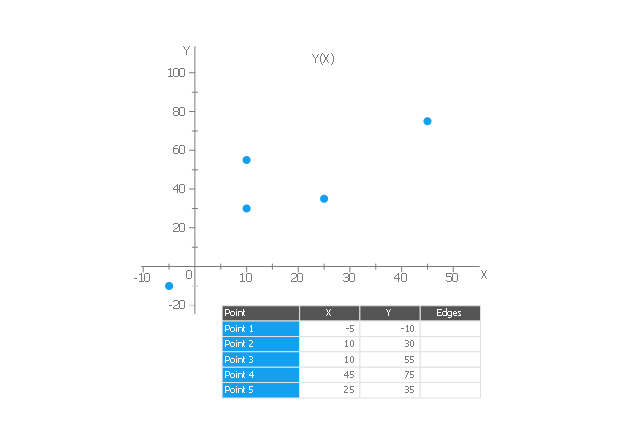
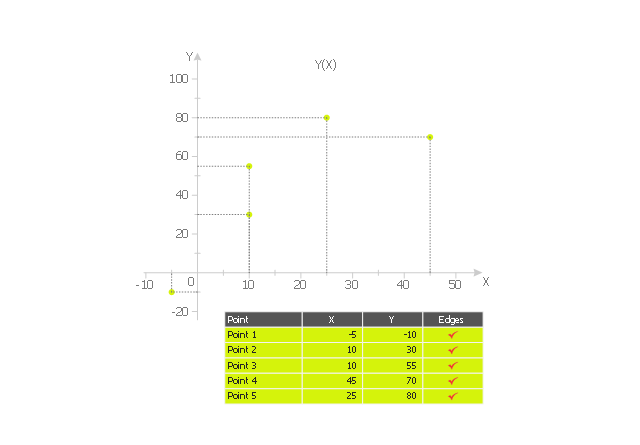
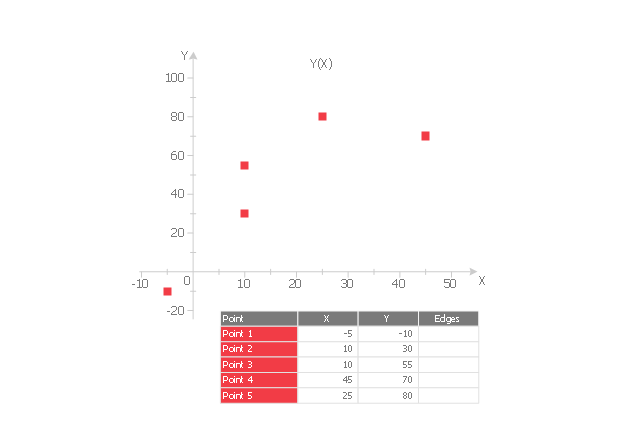
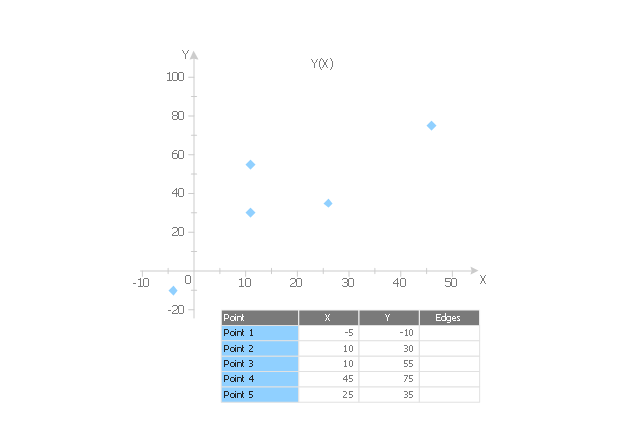
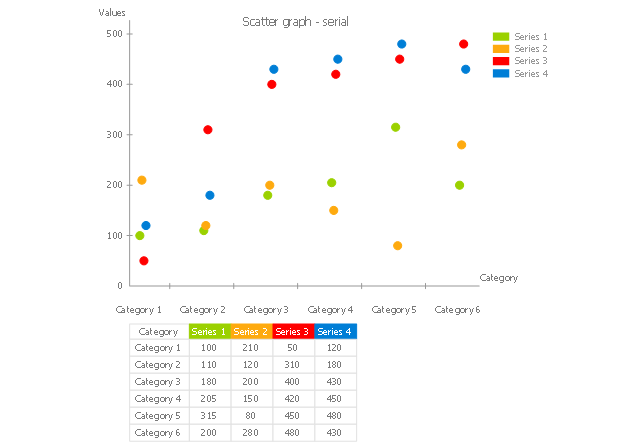
The vector stencils library "Scatter graphs" contains 7 templates of scatter diagrams (scattergraphs, scatter charts, scatter plots, scatterplots, scatter diagrams) for visual analysis of correlation between two variables.
Use these shapes to draw your scatterplots in the ConceptDraw PRO diagramming and vector drawing software.
The vector stencils library "Scatter graphs" is included in the Scatter Diagrams solution of the Graphs and Charts area in ConceptDraw Solution Park.
Use these shapes to draw your scatterplots in the ConceptDraw PRO diagramming and vector drawing software.
The vector stencils library "Scatter graphs" is included in the Scatter Diagrams solution of the Graphs and Charts area in ConceptDraw Solution Park.
The vector stencils library "Picture Graphs" contains 35 templates of picture bar graphs for visual data comparison and time series.
Drag a template from the library to your document, set bars number, type category labels, select bars and enter your data.
Use these shapes to draw your pictorial bar charts in the ConceptDraw PRO diagramming and vector drawing software.
The vector stencils library "Picture Graphs" is included in the Picture Graphs solution from the Graphs and Charts area of ConceptDraw Solution Park.
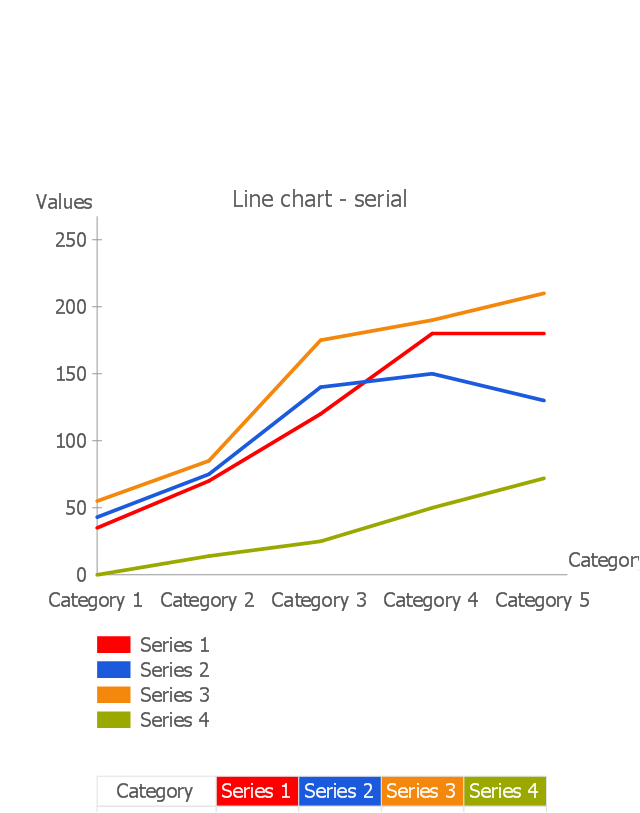
The vector stencils library "Line graphs" contains 5 templates of line graphs and scatter charts for visualizing data changes over time. Drag a template from the library to your document and enter your data.
Use these shapes to draw your line and scatter charts in the ConceptDraw PRO diagramming and vector drawing software.
The vector stencils library "Line graphs" is included in the Line Graphs solution from the Graphs and Charts area of ConceptDraw Solution Park.
Use these shapes to draw your line and scatter charts in the ConceptDraw PRO diagramming and vector drawing software.
The vector stencils library "Line graphs" is included in the Line Graphs solution from the Graphs and Charts area of ConceptDraw Solution Park.
Line Graph Charting Software
To design line and scatter charts use ConceptDraw PRO diagramming and vector drawing software extended with Line Graphs solution from Graphs and Charts area of ConceptDraw PRO Solution Park. (Line chart, scatter chart, 2d chart).Basic Diagramming
Create flowcharts, organizational charts, bar charts, line graphs, and more with ConceptDraw PRO.
Pictures of Graphs
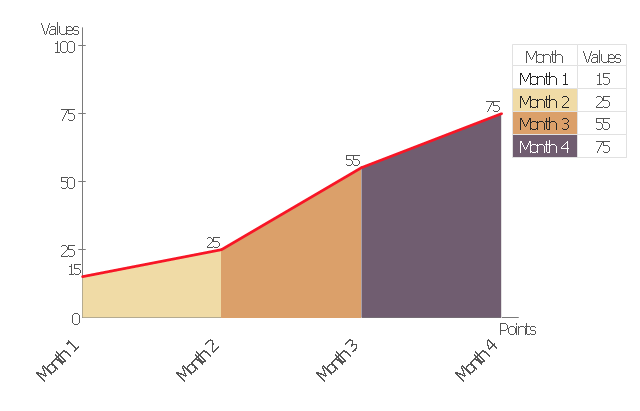
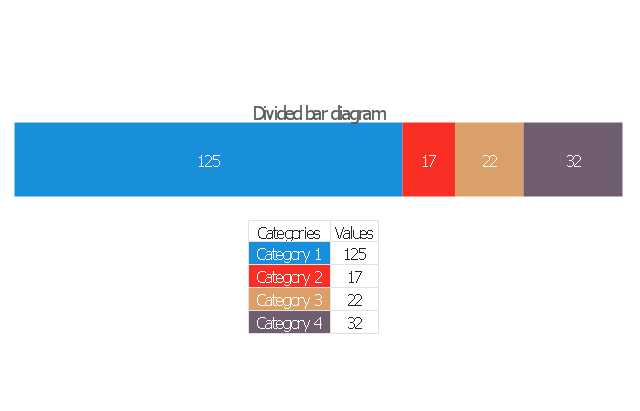
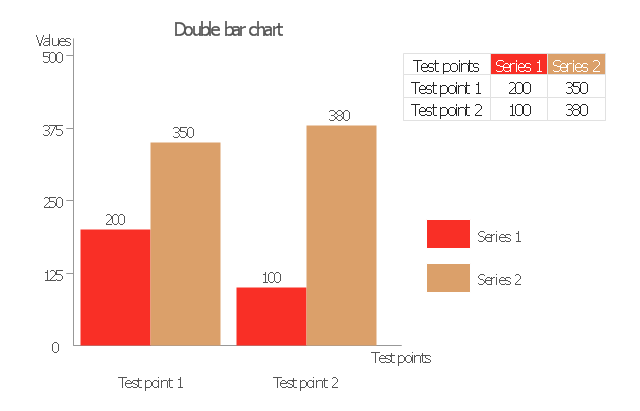
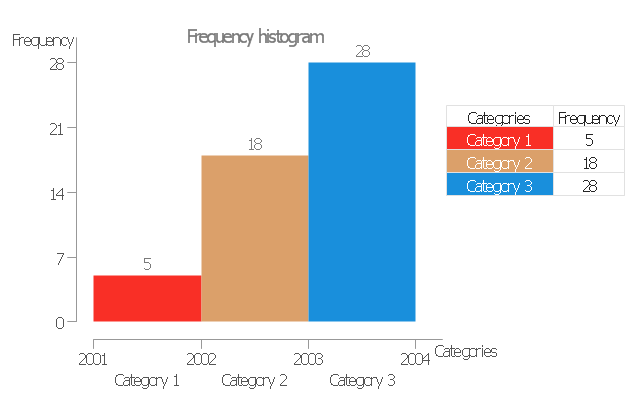
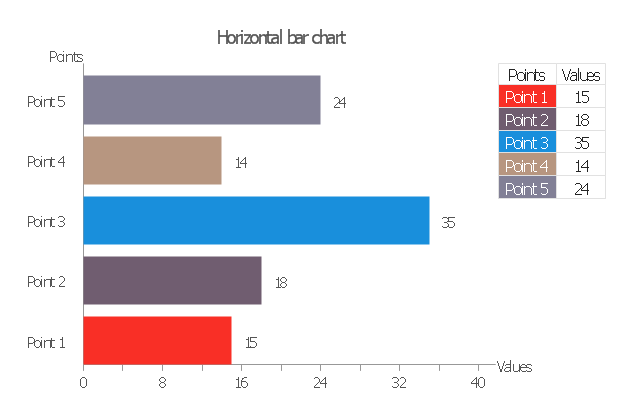
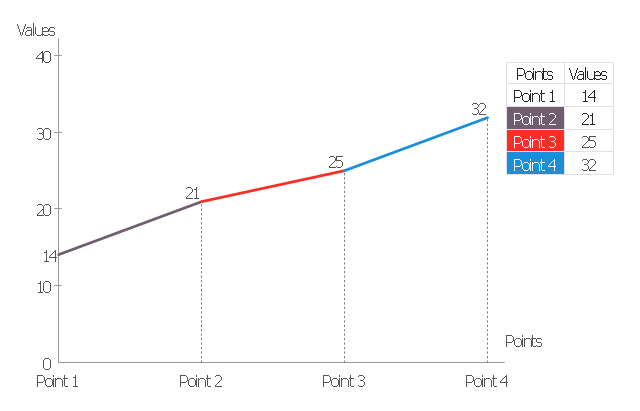
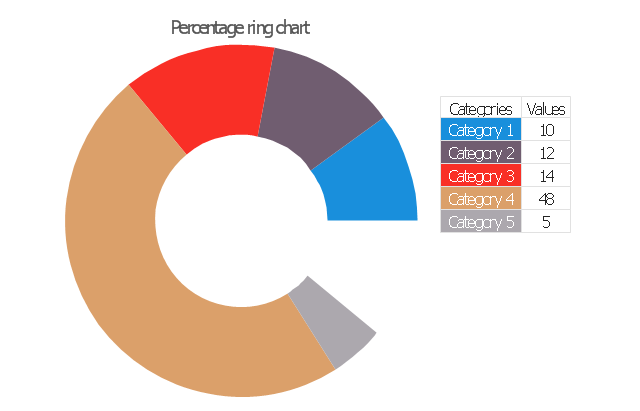
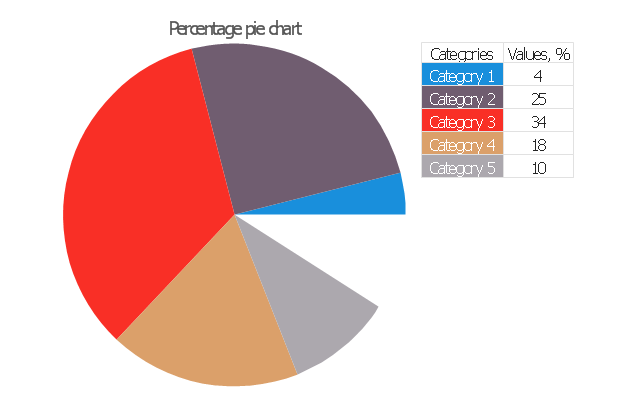
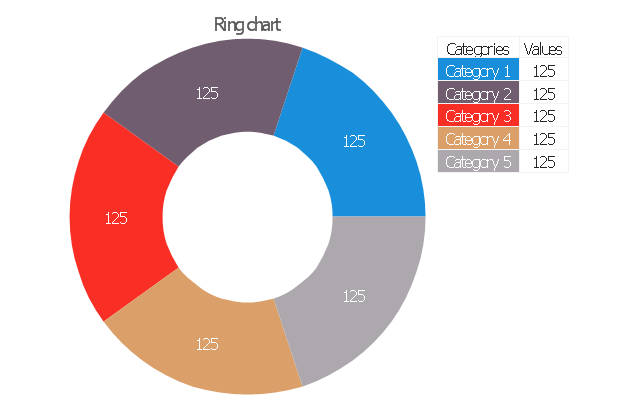
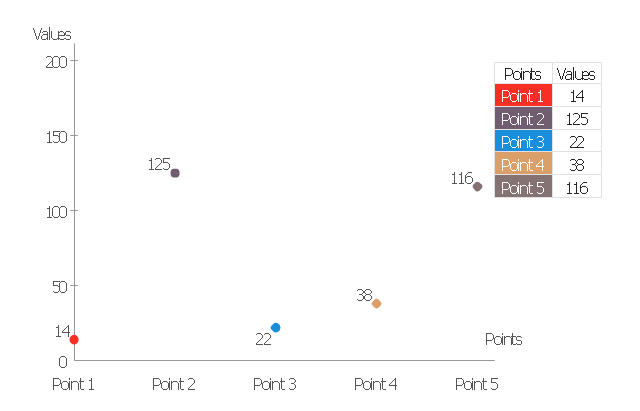
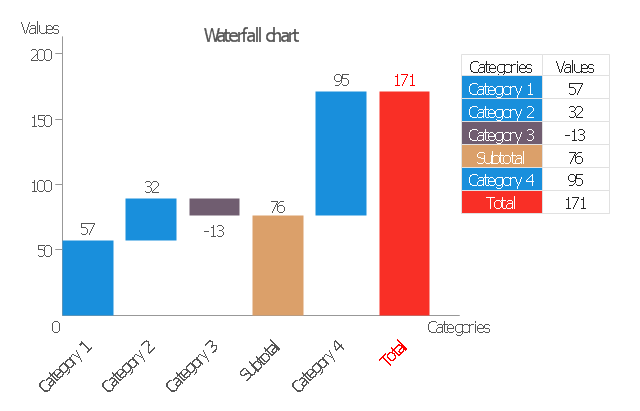
ConceptDraw PRO diagramming and vector drawing software extended with Picture Graphs solution from the Graphs and Charts Area is the best choice for making professional looking pictures of graphs and colorful picture graphs.The vector stencils library "Data-driven charts" contains 13 data-driven graphs and charts: area chart, divided bar diagram, double bar graph, frequency histogram, horizontal bar chart, line graph, percentage ring chart, percentage pie chart, scatter plot, column chart, waterfall chart.
Use it to visualize quantitative data in your data-driven infographics.
The graphs example "Data-driven charts - Vector stencils library" was created using the ConceptDraw PRO diagramming and vector graphics software extended with the Data-driven Infographics solution from the area "What is infographics" of ConceptDraw Solution Park.
Scatter Graph
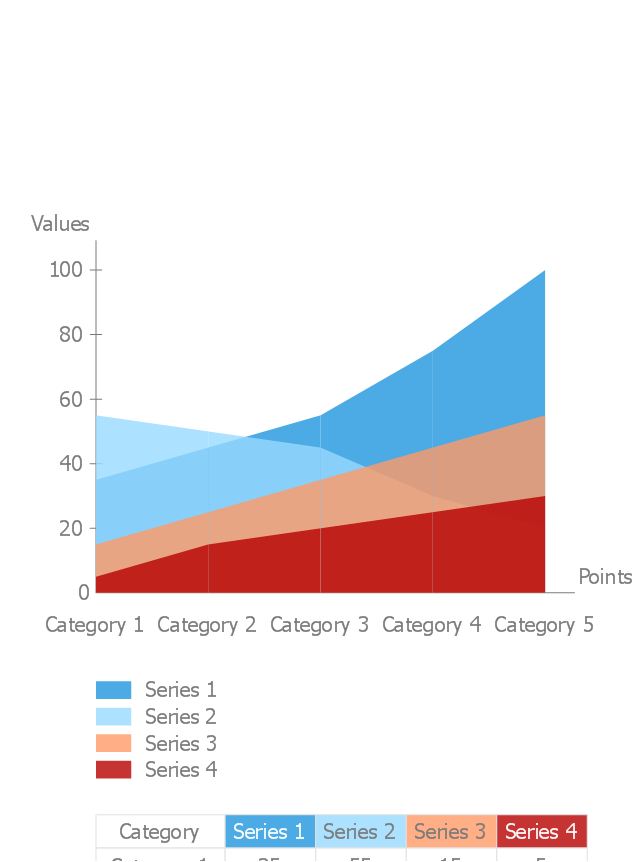
You've got to draw the Scatter Graph and look for the convenient tool which will help you? Direct your attention on the ConceptDraw PRO diagramming and vector drawing software extended with Scatter Diagrams Solution from the Graphs and Charts Area.The vector stencils library "Area charts" contains 9 area chart templates you can drag into your document and set data by numbers entering or moving control dots. Use these templates to draw your area graphs in the ConceptDraw PRO diagramming and vector drawing software.
The vector stencils library "Area charts" is included in the Area Charts solution from the Graphs and Charts area of ConceptDraw Solution Park.
The vector stencils library "Area charts" is included in the Area Charts solution from the Graphs and Charts area of ConceptDraw Solution Park.
How to Draw a Line Graph
In your work activity you need regularly draw the line graphs? And each time you ask yourself a question "How to Draw a Line Graph easier and faster?". The desire to automate the line graphs drawing process led to the creation of Line Graphs solution from Graphs and Charts area of ConceptDraw Solution Park.- Mobile - Vector stencils library | Picture graphs - Vector stencils ...
- Pyramid diagrams - Vector stencils library | Directional Maps | Bar ...
- Studies Books Vector Png
- Growth Graph Png
- Time Series Graph Png
- Rain Fall Vector Png
- Sales Growth. Bar Graphs Example | Basic Diagramming | BCG ...
- Marketing mix - Wheel diagram | Product life cycle graph | Sales ...
- Scatter Plot Graph Png


-line-graphs---vector-stencils-library.png--diagram-flowchart-example.png)
-line-graphs---vector-stencils-library.png--diagram-flowchart-example.png)
-line-graphs---vector-stencils-library.png--diagram-flowchart-example.png)
-line-graphs---vector-stencils-library.png--diagram-flowchart-example.png)



-data-driven-charts---vector-stencils-library.png--diagram-flowchart-example.png)

-area-charts---vector-stencils-library.png--diagram-flowchart-example.png)
-area-charts---vector-stencils-library.png--diagram-flowchart-example.png)
-area-charts---vector-stencils-library.png--diagram-flowchart-example.png)
-area-charts---vector-stencils-library.png--diagram-flowchart-example.png)
-area-charts---vector-stencils-library.png--diagram-flowchart-example.png)
-area-charts---vector-stencils-library.png--diagram-flowchart-example.png)
-area-charts---vector-stencils-library.png--diagram-flowchart-example.png)
-area-charts---vector-stencils-library.png--diagram-flowchart-example.png)
