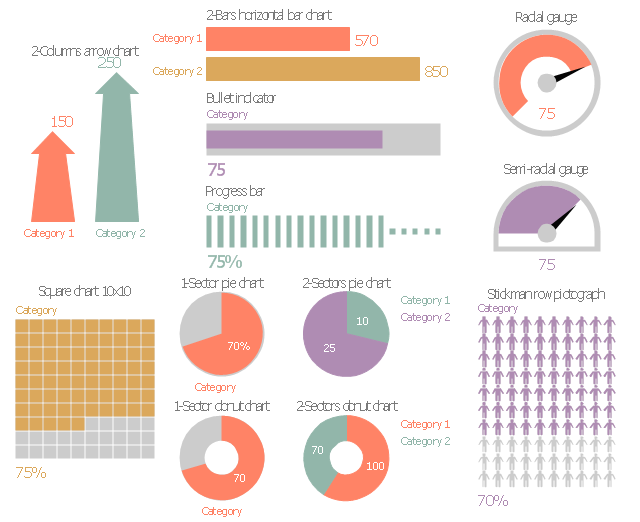
The vector stencils library "Marketing indicators" contains 12 graphic indicators: horizontal bar chart, pie chart, arrow chart, donut chart, square chart, stickman row pictograph, progress bar, bullet indicator, radial gauge, semi-radial gauge.
Use these visual indicators to design your marketing infograms.
The shapes example "Design elements - Marketing indicators" was created using the ConceptDraw PRO diagramming and vector drawing software extended with the Marketing Infographics solition from the area "Business Infographics" in ConceptDraw Solution Park.
 Sales Flowcharts
The Sales Flowcharts solution lets you create and display sales process maps, sales process workflows, sales steps, the sales process, and anything else involving sales process management.
Bubble diagrams in Landscape Design with ConceptDraw DIAGRAM
Bubble Diagrams are the charts with a bubble presentation of data with obligatory consideration of bubble's sizes. They are analogs of Mind Maps and find their application at many fields, and even in landscape design. At this case the bubbles are applied to illustrate the arrangement of different areas of future landscape design, such as lawns, flowerbeds, playgrounds, pools, recreation areas, etc. Bubble Diagram helps to see instantly the whole project, it is easy for design and quite informative, in most cases it reflects all needed information. Often Bubble Diagram is used as a draft for the future landscape project, on the first stage of its design, and in case of approval of chosen design concept is created advanced detailed landscape plan with specification of plants and used materials. Creation of Bubble Diagrams for landscape in ConceptDraw DIAGRAM software is an easy task thanks to the Bubble Diagrams solution from "Diagrams" area. You can use the ready scanned location plan as the base or create it easy using the special ConceptDraw libraries and templates.- Graphic Arrows Png Hd
- Sun Arrow Png
- Arrow Graphics Illustration Png
- Arrow Graphic Vector Png
- Arrow Design Png
- Modern Graphic Arrow Png
- Ui Arrow Png
- Arrow Callouts Designs Png
- U.S. Medicare spending per capita | Graphic User Interface | How To ...
- Round Arrow Design Png
- Visio Arrows Png
- Design elements - Education callouts | Design elements - Callouts ...
- Cliparts Design Png
- Arrow Flow Png
- Bracket Arrow Vector Png
- Png Image Arrow
- Curved Lines Design Png
- Partnership Clipart Png
- Beautiful Arrow Png
- Curved Line Design Png

