 ConceptDraw Solution Park
ConceptDraw Solution Park collects graphic extensions, examples and learning materials
Software development with ConceptDraw DIAGRAM
Modern software development requires creation of large amount of graphic documentation, these are the diagrams describing the work of applications in various notations and cuts, also GUI design and documentation on project management. ConceptDraw DIAGRAM technical and business graphics application possesses powerful tools for software development and designing technical documentation for object-oriented projects. Solutions included to the Software Development area of ConceptDraw Solution Park provide the specialists with possibility easily and quickly create graphic documentation. They deliver effective help in drawing thanks to the included package of templates, samples, examples, and libraries with numerous ready-to-use vector objects that allow easily design class hierarchies, object hierarchies, visual object-oriented designs, flowcharts, GUI designs, database designs, visualize the data with use of the most popular notations, including the UML and Booch notations, easy manage the development projects, automate projection and development.HelpDesk
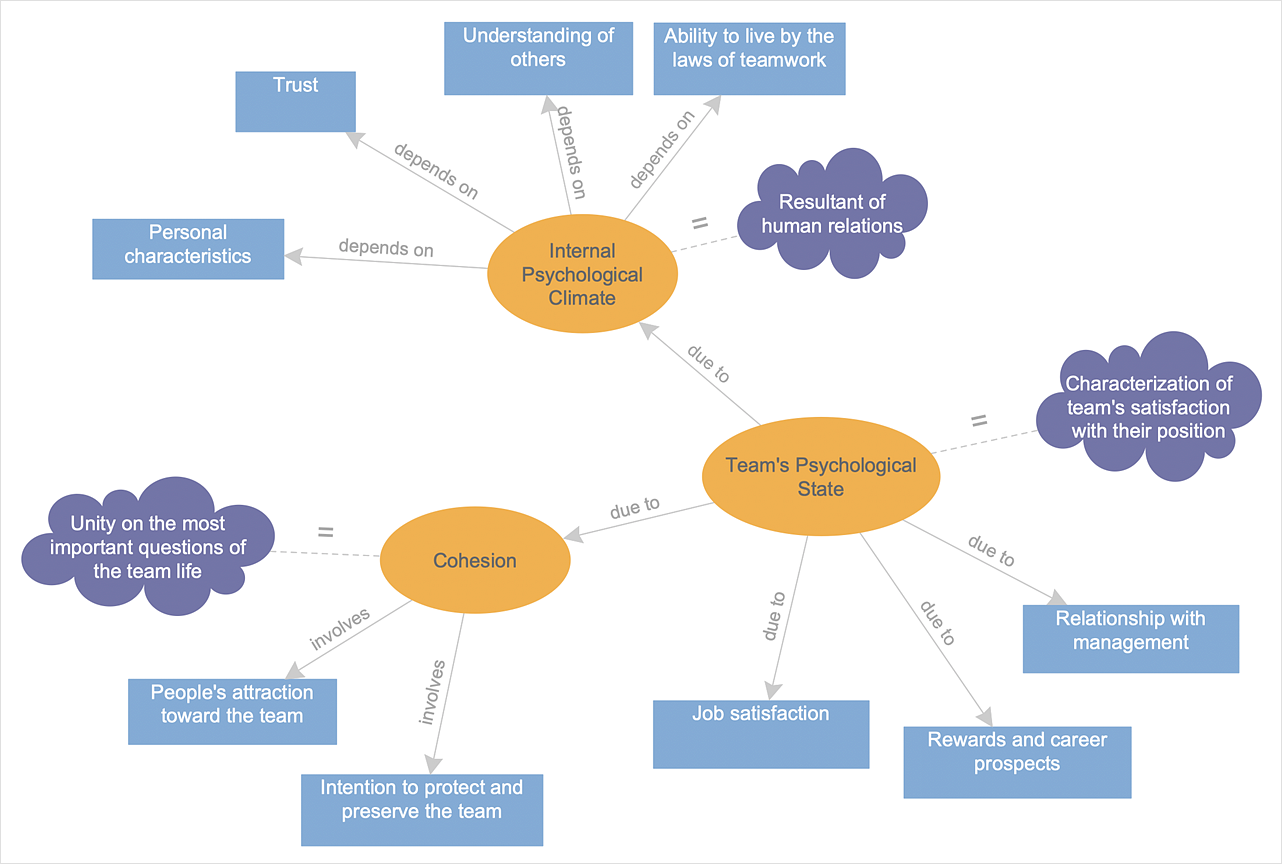
How to Create a Concept Map
The graphical technique of knowledge representation in the form of structured networks of concepts (ideas) is called concept mapping. Concept network consists of shapes that represent concepts and connectors representing relationships between concepts. The difference between mind maps and concept maps is that a mind map has only one object depicting the main idea, while a concept map may have several. Concept mapping is used to structure ideas, to communicate a complex system of knowledge, to help the learning process, etc. ConceptDraw DIAGRAM allows you to draw concept maps using the Concept Map solution.HelpDesk
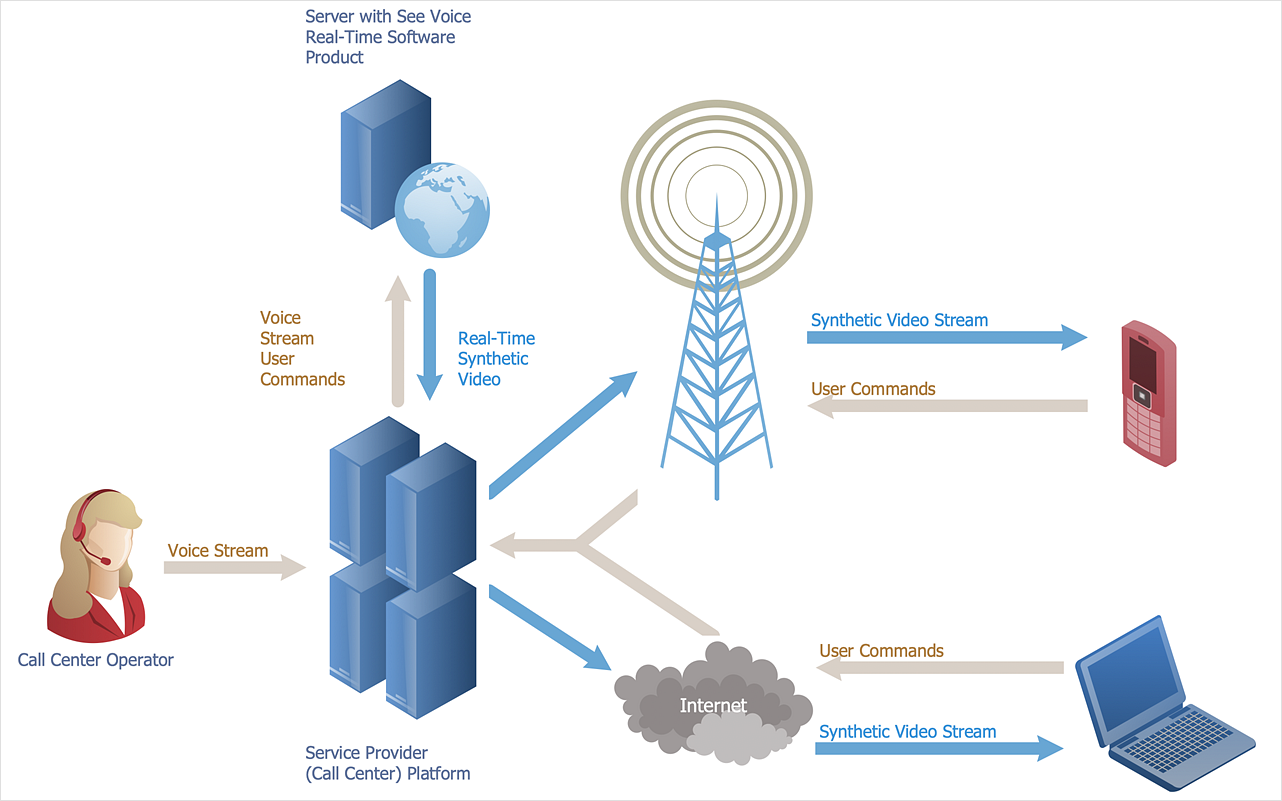
How to Create a Telecommunication Network Diagram
Telecommunication network diagram displays components and connections in a telecommunication network: how they are interacted between each other and with end-users. Telecommunication network diagrams usually created by system engineers for planning telecom networks. Also, they may be useful for a network management. Telecom network diagram visualizes the level of security and user access to certain equipment and data within a current network. Telecom network diagram can be used to identify weak points of an entire network or a part of it. ConceptDraw DIAGRAM allows you to draw a simple and clear Telecommunication Network diagrams.HelpDesk
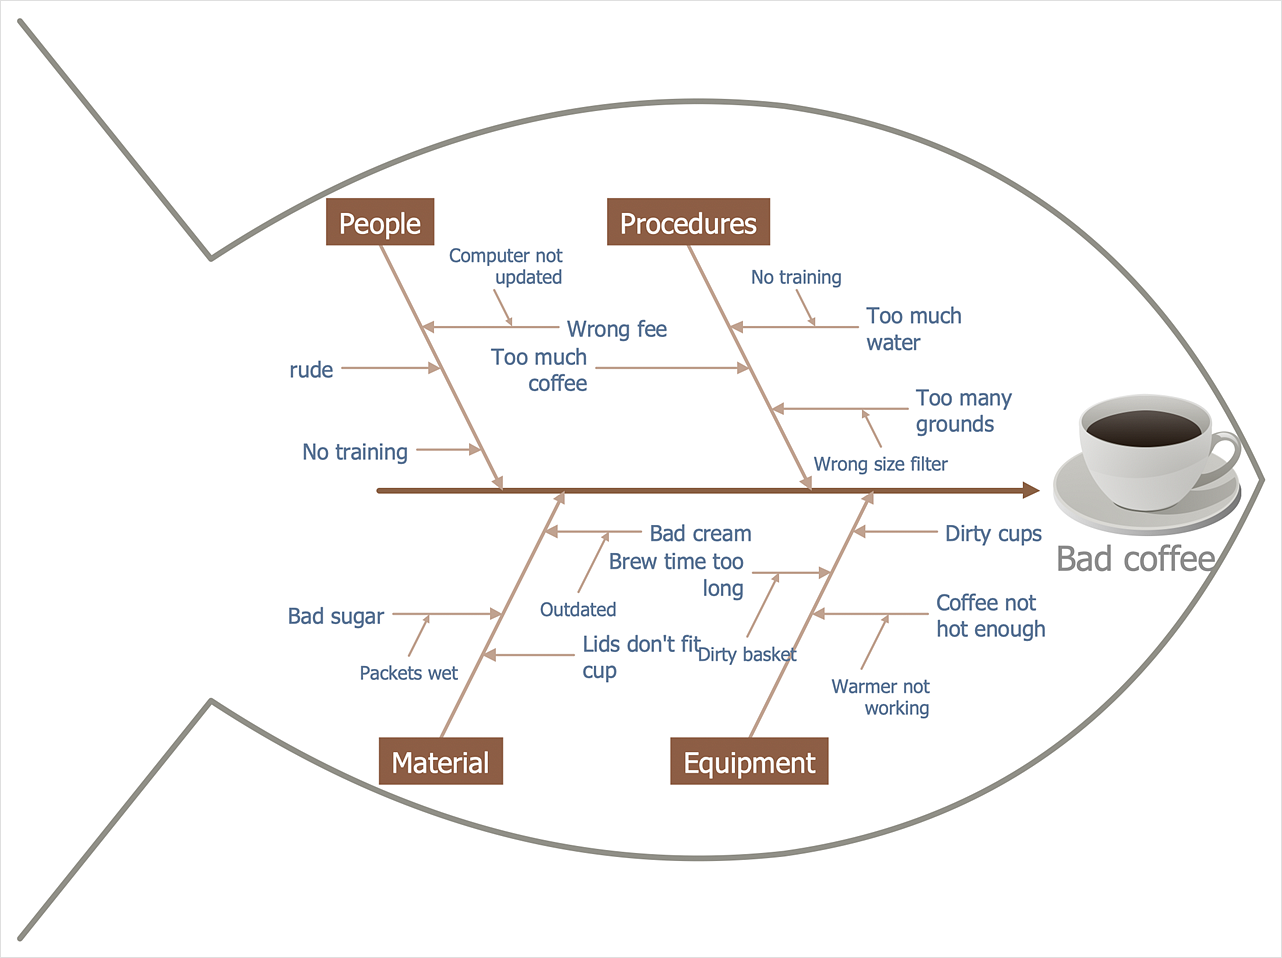
How to Draw a Fishbone Diagram
Fishbone (Ishikawa) Diagram is often used in business to determine the cause of some problem. A Fishbone diagram is also called the cause-and-effect diagram. The main goal of the Fishbone diagram is to illustrate in a graphical way the relationship between a given outcome and all the factors that influence this outcome. The complete diagram resembles a fish skeleton as its name implies. Cause and Effect analysis is used in management to identify the possible causes of a problem in order to eliminate them. The ability to create a Fishbone Diagram is supported by the Fishbone Diagram solution.HelpDesk
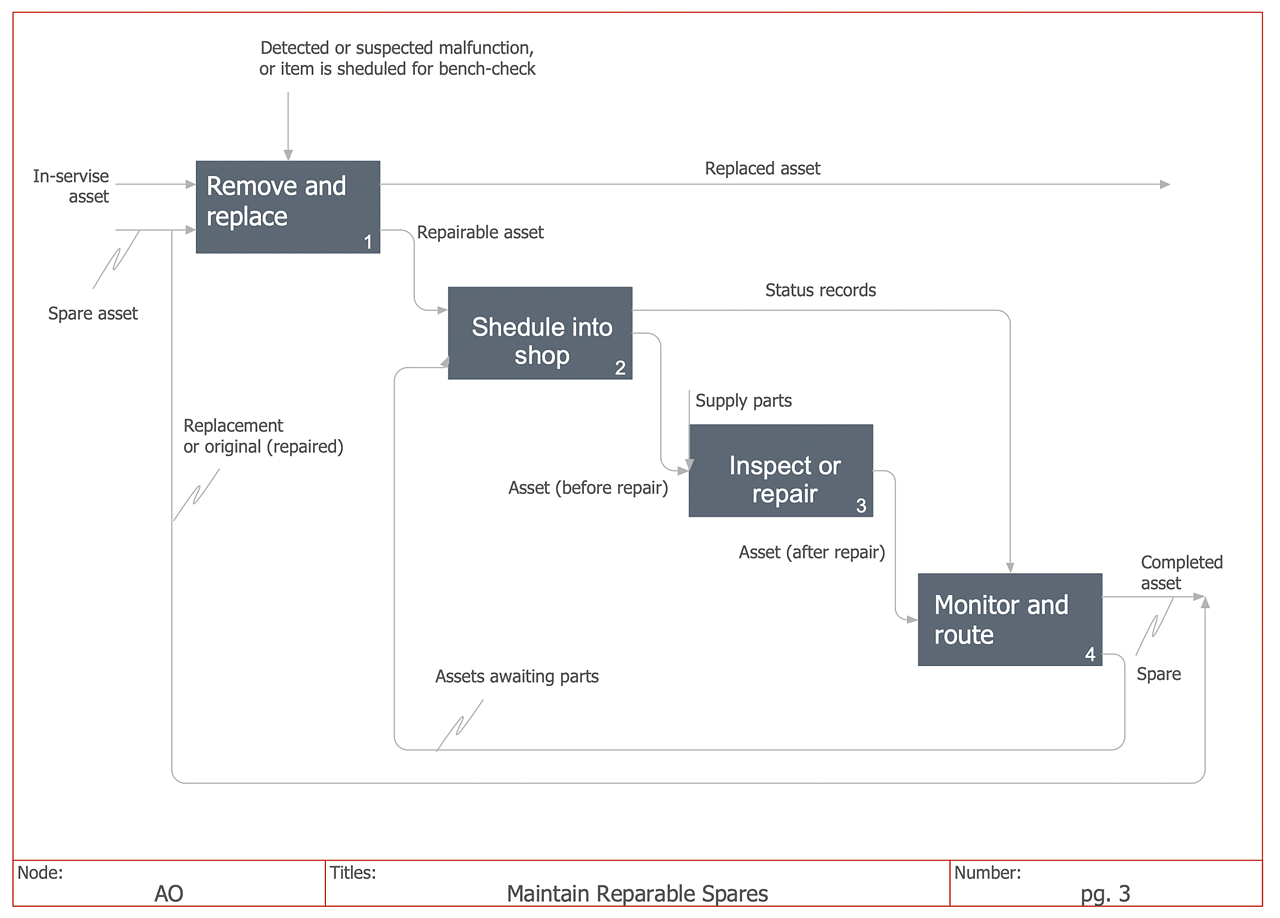
How to Create an IDEF0 Diagram for an Application Development
IDEF0 methods are intended to model the functions of a process, creating a graphical model that displays: what controls the function, who makes it, what resources are used and how they are connected with other functions. The IDEF0 tool is used to model the decisions, actions, and activities of a software system during the development process. IDEF0 diagram graphically depicts a model of a desired version of the application. ConceptDraw DIAGRAM allows you to create and communicate the IDEF0 diagrams of any complexity.- How To use Furniture Symbols for Drawing Building Plan
- ERD Symbols and Meanings | Entity Relationship Diagram Symbols ...
- Electrical Drawing Software | How To use House Electrical Plan ...
- Interior Design Office Layout Plan Design Element | How To Create ...
- How To use Furniture Symbols for Drawing Building Plan ...
- Network Glossary Definition | Graphical Symbol Of Linear Integrated ...
- Flowchart design. Flowchart symbols , shapes, stencils and icons ...
- How To Draw Building Plans | Electrical Engineering | A Flow Chart ...
- Floor Plans Telecommunication Center
- Factory layout floor plan | Plant Layout Plans | Design elements ...
- How To Create Restaurant Floor Plans in Minutes | Software and ...
- Basic Flowchart Symbols and Meaning | Process Flowchart | How to ...
- Value Stream Mapping Symbols | Entity Relationship Diagram ...
- Building Drawing Software for Design Office Layout Plan | Design ...
- Vector design elements - Presentation symbols | Entity Relationship ...
- Basic Flowchart Symbols and Meaning | Process Flowchart | Data ...
- Camera layout schematic | Design elements - Video | CCTV Network ...
- Building Drawing Design Element: Piping Plan | Building Drawing ...
- Office Layout | Office Layout Plans | How To Draw Building Plans ...
- Supermarket parking - Site plan | Advertising creation process ...


