Competitor Analysis

 Marketing Diagrams
Marketing Diagrams solution extends ConceptDraw PRO diagramming software with abundance of samples, templates and vector design elements intended for easy graphical visualization and drawing different types of Marketing diagrams and graphs, including Branding Strategies Diagram, Five Forces Model Diagram, Decision Tree Diagram, Puzzle Diagram, Step Diagram, Process Chart, Strategy Map, Funnel Diagram, Value Chain Diagram, Ladder of Customer Loyalty Diagram, Leaky Bucket Diagram, Promotional Mix Diagram, Service-Goods Continuum Diagram, Six Markets Model Diagram, Sources of Customer Satisfaction Diagram, etc. Analyze effectively the marketing activity of your company and apply the optimal marketing methods with ConceptDraw PRO software.
Basic Flowchart Symbols and Meaning


Business Productivity - Marketing

Basic Diagramming


 Fishbone Diagrams
The Fishbone Diagrams solution extends ConceptDraw PRO v10 software with the ability to easily draw the Fishbone Diagrams (Ishikawa Diagrams) to clearly see the cause and effect analysis and also problem solving. The vector graphic diagrams produced using this solution can be used in whitepapers, presentations, datasheets, posters, and published technical material.
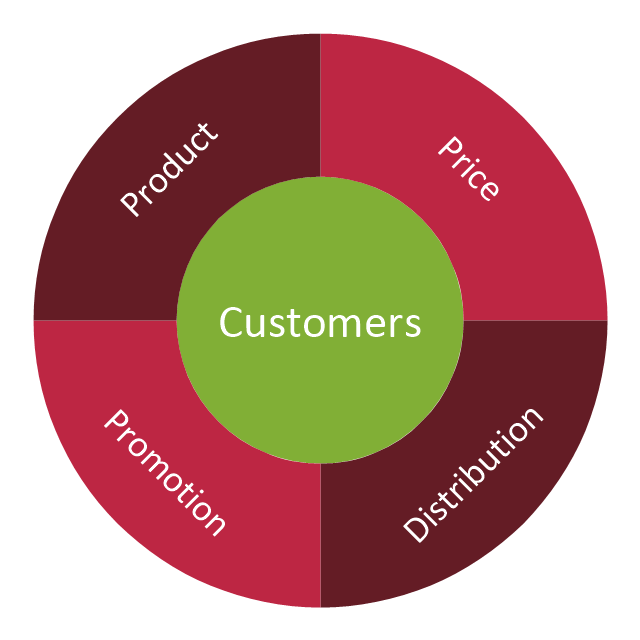
"The marketing mix is a business tool used in marketing and by marketing professionals. The marketing mix is often crucial when determining a product or brand's offer, and is often synonymous with the four Ps: price, product, promotion, and place ..." [Marketing mix. Wikipedia]
The example of wheel diagram (ring diagram, bevel style circle diagram, circular diagram) "Marketing mix" was created using the ConceptDraw PRO diagramming and vector drawing software extended with the Target and Circular Diagrams solution from the Marketing area of ConceptDraw Solution Park.
www.conceptdraw.com/ solution-park/ marketing-target-and-circular-diagrams
Marketing mix - Wheel diagram
Project —Task Trees and Dependencies

Block Diagram Creator

 Target and Circular Diagrams
This solution extends ConceptDraw PRO software with samples, templates and library of design elements for drawing the Target and Circular Diagrams.
 Project Exchange
This solution extends ConceptDraw PROJECT and ConceptDraw MINDMAP software with the ability to import and export project data.
ConceptDraw PRO: Able to Leap Tall Buildings in a Single Bound

 Block Diagrams
Block diagrams solution extends ConceptDraw PRO software with templates, samples and libraries of vector stencils for drawing the block diagrams.
- Graph Or Diagram Product Mix In Service Marketing
- Competitor Analysis | Marketing | Target Diagram | Product Mix ...
- Marketing Mix In Marketing Graphs
- Graphs On Marketing Mix
- Product Mix Graph
- Sales Growth. Bar Graphs Example | Sales Dashboards for Your ...
- Product life cycle graph
- Product life cycle graph - Template
- Diagram Of Product Mix
- Scatter graph - Template | Line graph - Template | Picture graph ...
- Graph Marketing Mix
- Product Mix Digram
- Graph Of Marketing Mix
- Chart Of Product Mix
- Product Service And Solution Graph
- Sales Growth. Bar Graphs Example | Sales KPIs and Metrics - Vector ...
- Marketing mix - Wheel diagram | Target diagrams - Vector stencils ...
- Marketing Mix Template
- Chart Examples | Line Graph Charting Software | Picture Graphs ...