This is product lifecycle graph (PLC) diagram template.
Use it to design your product lifecycle graphs with ConceptDraw PRO software.
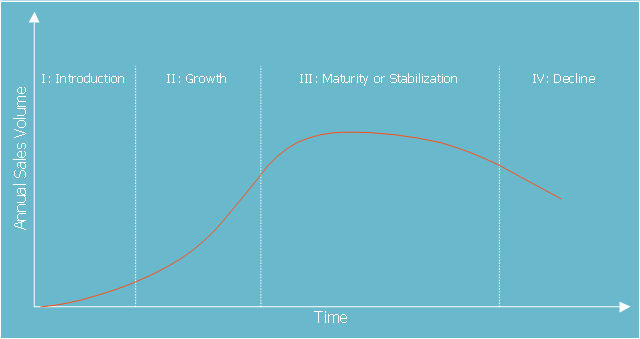
PLC graph visualizes a new product progress through a sequence of stages from introduction to Growth, Maturity, and Decline. This sequence is associated with changes in the marketing situation, thus impacting the marketing strategy and the marketing mix. The product revenue and profits can also be plotted as a function of the PLC stages.
The marketing chart template "Product life cycle graph" is included in the Marketing Diagrams solution from the Marketing area of ConceptDraw Solution Park.
Use it to design your product lifecycle graphs with ConceptDraw PRO software.
PLC graph visualizes a new product progress through a sequence of stages from introduction to Growth, Maturity, and Decline. This sequence is associated with changes in the marketing situation, thus impacting the marketing strategy and the marketing mix. The product revenue and profits can also be plotted as a function of the PLC stages.
The marketing chart template "Product life cycle graph" is included in the Marketing Diagrams solution from the Marketing area of ConceptDraw Solution Park.
Marketing graph template
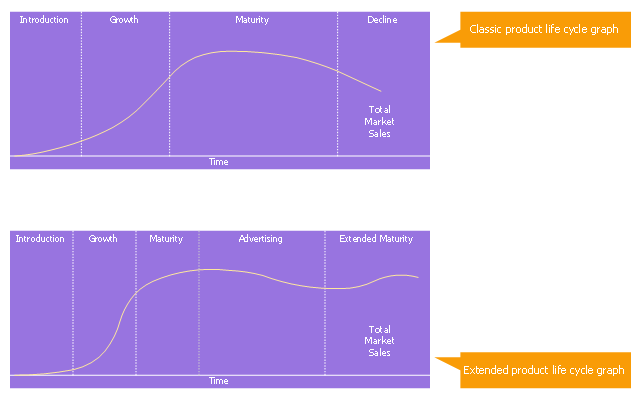
This marketing chart sample represents product life cycle. It was designed on the base of the Wikimedia Commons file: Product life-cycle curve.jpg. [commons.wikimedia.org/ wiki/ File:Product_ life-cycle_ curve.jpg]
This file is licensed under the Creative Commons Attribution-Share Alike 4.0 International license. [creativecommons.org/ licenses/ by-sa/ 4.0/ deed.en]
The marketing chart example "Product life cycle graph" was created using the ConceptDraw PRO diagramming and vector drawing software extended with the Marketing Diagrams solution from the Marketing area of ConceptDraw Solution Park.
Marketing chart
 Marketing Diagrams
Marketing Diagrams solution extends ConceptDraw PRO diagramming software with abundance of samples, templates and vector design elements intended for easy graphical visualization and drawing different types of Marketing diagrams and graphs, including Branding Strategies Diagram, Five Forces Model Diagram, Decision Tree Diagram, Puzzle Diagram, Step Diagram, Process Chart, Strategy Map, Funnel Diagram, Value Chain Diagram, Ladder of Customer Loyalty Diagram, Leaky Bucket Diagram, Promotional Mix Diagram, Service-Goods Continuum Diagram, Six Markets Model Diagram, Sources of Customer Satisfaction Diagram, etc. Analyze effectively the marketing activity of your company and apply the optimal marketing methods with ConceptDraw PRO software.
The vector stencils library "Marketing diagrams" contains 12 templates of marketing and sales diagrams and charts. Use it to illustrate your marketing and sales documents, presentations, infographics and webpages in ConceptDraw PRO software extended with Marketing Diagrams solution from Marketing area of ConceptDraw Solution Park.
Diffusion of Innovations

Normal distribution

Five forces model

Leaky bucket diagram

Funnel diagram

Relationship ladder of customer loyalty

Six markets model

Product life cycle graph

Extended product life cycle graph

Service-goods continuum diagram

Step chart block

Step diagram block

 Circular Arrows Diagrams
Circular Arrows Diagrams solution extends ConceptDraw PRO v10 with extensive drawing tools, predesigned samples, Circular flow diagram template for quick start, and a library of ready circular arrow vector stencils for drawing Circular Arrow Diagrams, Segmented Cycle Diagrams, and Circular Flow Diagrams. The elements in this solution help managers, analysts, business advisers, marketing experts, scientists, lecturers, and other knowledge workers in their daily work.
Process Flowchart


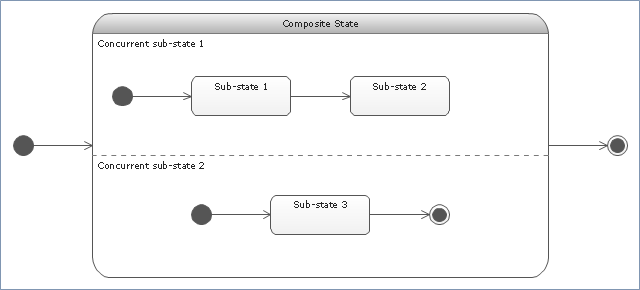
"State machine diagram is a behavior diagram which shows discrete behavior of a part of designed system through finite state transitions. State machine diagrams can also be used to express the usage protocol of part of a system. Two kinds of state machines defined in UML 2.4 are:
(1) behavioral state machine, and
(2) protocol state machine.
The following nodes and edges are typically drawn in state machine diagram: behavioral state, behavioral transition, protocol state, protocol transition, different pseudostates. ...
Behavioral state machine is specialization of behavior and is used to specify discrete behavior of a part of designed system through finite state transitions. The state machine formalism used in this case is an object-based variant of Harel statecharts.
Behavior is modeled as a traversal of a graph of state nodes connected with transitions. Transitions are triggered by the dispatching of series of events. During the traversal, the state machine could also execute some activities. ...
Protocol state machine is a specialization of behavioral state machine and is used to express usage protocol or lifecycle of a classifier. It specifies which operations of the classifier can be called in which state and under which condition, thus specifying the allowed call sequences on the classifier’s operations. Protocol state machines express the legal transitions that a classifier can trigger." [uml-diagrams.org/ state-machine-diagrams.html]
The template "UML state machine diagram" for the ConceptDraw PRO diagramming and vector drawing software is included in the Rapid UML solution from the Software Development area of ConceptDraw Solution Park.
www.conceptdraw.com/ solution-park/ software-uml
UML state machine diagram
Basic Flowchart Symbols and Meaning


The vector stencils library "Circular diagrams" contains 42 templates of circular diagrams: circular arrow diagram, circular motion diagram, arrow ring chart, doughnut chart (donut chart), circle pie chart, diamond pie chart, circle diagram, pie chart, ring chart, loop diagram, block loop diagram, arrow loop circle, crystal diagram, triangular diagram, diamond diagram, pentagon diagram, hexagon diagram, heptagon diagram, cycle diagram (cycle chart), stacked Venn diagram (onion diagram), arrow circle diagram.
Use these shapes to illustrate your marketing and sales documents, presentations, webpages and infographics in the ConceptDraw PRO diagramming and vector drawing software extended with the Target and Circular Diagrams solution from the Marketing area of ConceptDraw Solution Park.
www.conceptdraw.com/ solution-park/ marketing-target-and-circular-diagrams
Circular arrow diagram 1
Circular arrow diagram 2
Arrow ring chart
Doughnut chart

Diamond pie chart

Pie chart

Circle diagram

Circle pie chart 2

Circle pie chart 1

Ring chart 1 - 3 elements

Ring chart 1 - 4 elements

Ring chart 1 - 5 elements

Ring chart 1 - 6 elements

Ring chart 1 - 7 elements

Ring chart 2 - 3 elements

Ring chart 2 - 4 elements

Ring chart 2 - 5 elements

Ring chart 2 - 6 elements

Ring chart 2 - 7 elements

Crystal diagram - 3 elements

Crystal diagram - 4 elements

Crystal diagram - 5 elements

Crystal diagram - 6 elements

Crystal diagram - 7 elements

Stacked Venn diagram - 4

Stacked Venn diagram - 5

Stacked Venn diagram - 6

Stacked Venn diagram - 7

Basic loop diagram

Block loop diagram

Arrow loop circle
Arrow loop - 3 circles
Arrow loop - 4 circles
Arrow loop - 5 circles
Arrow loop - 6 circles
Arrow loop - 7 circles
Arrow circle diagram - 3
Arrow circle diagram - 4
Stacked Venn diagram - 3

Arrow circle diagram - 5
Arrow circle diagram - 6
Arrow circle diagram - 7
- Product life cycle graph
- Product life cycle graph template | Use the Best FlowChart Tool for ...
- Product life cycle graph | Draw Flowcharts with ConceptDraw ...
- Create A Product Life Cycle Graph
- Picture graph template | Line graph template | Product life cycle ...
- Product life cycle graph template | Marketing Diagrams | Good Flow ...
- Product life cycle graph template | Design elements - Marketing ...
- Product life cycle graph | Marketing Diagrams
- Product life cycle graph | Draw Flowcharts with ConceptDraw ...
- Design elements - Marketing diagrams | Product life cycle graph ...
- Product life cycle graph template | Good Flow Chart app for Mac ...
- Product life cycle process - Flowchart | Product life cycle graph ...
- Product life cycle graph | Good Flow Chart app for Mac | Design ...
- Product life cycle graph - Template
- Product life cycle graph template
- Product life cycle graph
- Product life cycle graph template | Marketing Diagrams | Basic ...
- Marketing Diagrams | Marketing | Product life cycle graph | Diagrams ...
- Marketing Diagrams | Basic Diagramming | Graph Example Life ...
- Draw Flowcharts with ConceptDraw | Product life cycle graph ...