This cycle process chart was redesigned from the Wikimedia Commons file: Business Feedback Loop PNG version.png.
"A business ideally is continually seeking feedback from customers: are the products helpful? are their needs being met? Constructive criticism helps marketers adjust offerings to meet customer needs."
[commons.wikimedia.org/ wiki/ File:Business_ Feedback_ Loop_ PNG_ version.png]
The cycle process diagram example "Business feedback loop" was created using the ConceptDraw PRO diagramming and vector drawing software extended with the Sales Flowcharts solution from the Marketing area of ConceptDraw Solution Park.
DroidDia PRO unlocker
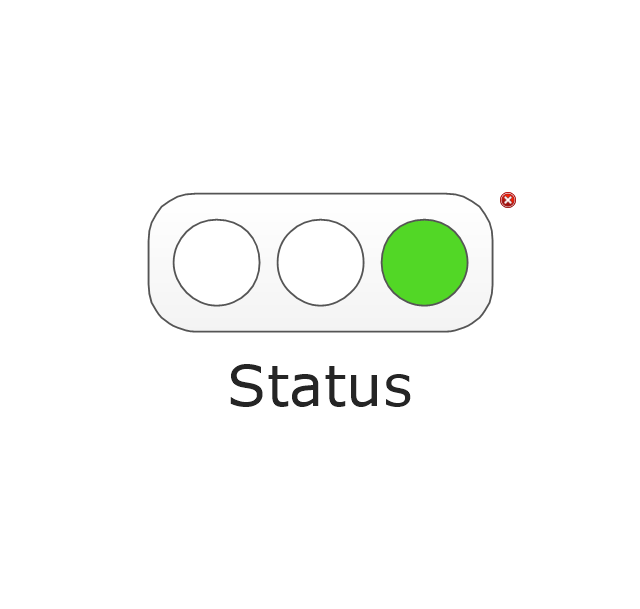
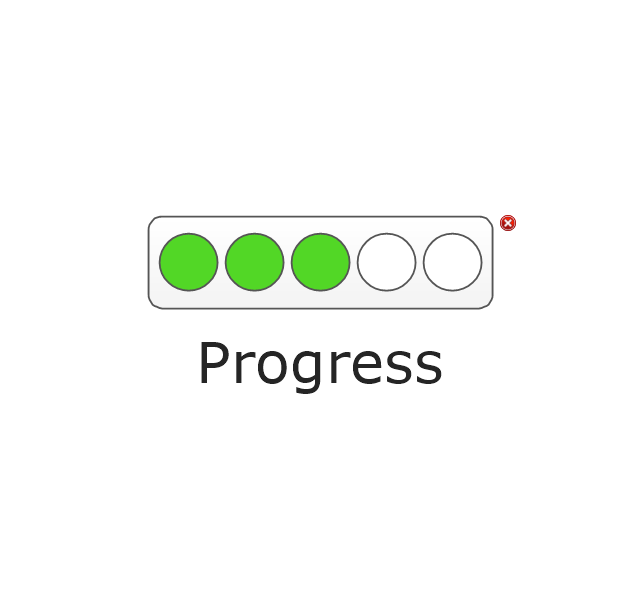
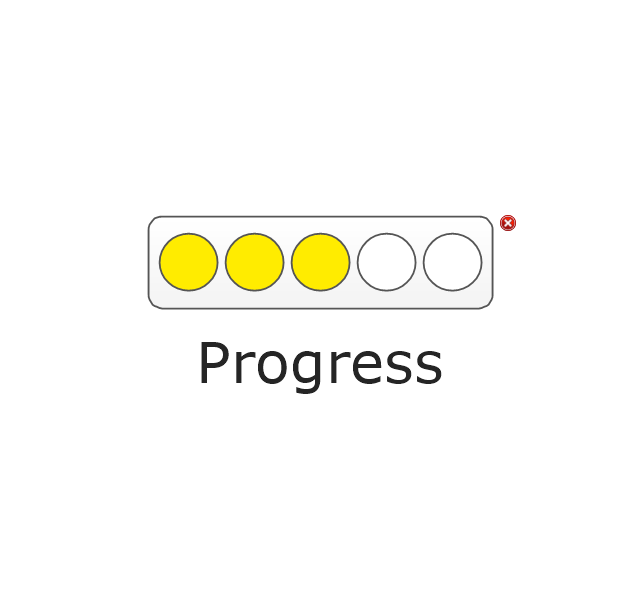
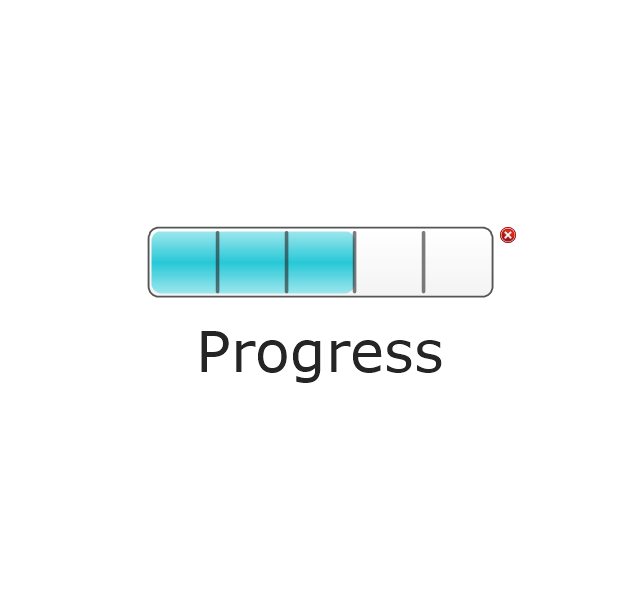
Droiddia allows you to make flow charts org charts venn diagrams mindmaps and do other diagrams with no constrains and as little effort as possible.The vector stencils library "Status indicators" contains 41 visual status indicators. Each status indicator can visualize one of 2-6 information states and have a caption.
Use it to create your business performance dashboards in the ConceptDraw PRO diagramming and vector drawing software extended with the Status Dashboard solution from the area "What is a Dashboard" of ConceptDraw Solution Park.
Use it to create your business performance dashboards in the ConceptDraw PRO diagramming and vector drawing software extended with the Status Dashboard solution from the area "What is a Dashboard" of ConceptDraw Solution Park.
DroidDia prime
Droiddia allows you to make flow charts org charts venn diagrams mindmaps and do other diagrams with no constrains and as little effort as possible.
 Pie Charts
Pie Charts are extensively used in statistics and business for explaining data and work results, in mass media for comparison (i.e. to visualize the percentage for the parts of one total), and in many other fields. The Pie Charts solution for ConceptDraw PRO v10 offers powerful drawing tools, varied templates, samples, and a library of vector stencils for simple construction and design of Pie Charts, Donut Chart, and Pie Graph Worksheets.
- Different Arrows Png
- Rounded Arrow Png
- Pink Circle Png
- Curved Arrow Circle Clip Art
- Icon Gray Png
- Curved Arrow Icon Png
- Icon Arrow Png
- Arrow Flow Png
- Arrow Png
- Yellow Stream Png
- Grey Vertical Line Png Hd
- Yellow Arrows Down Png
- Buildings and green spaces - Vector stencils library | Buildings and ...
- Santa And Sleigh Png
- Refresh Icon White Png
- Orange Triangle Png
- Indicator Icon Png
- Rectangular Ribbon Png
- Vertical White Line Transparent Png
- Building Clipart Png

.jpg)
























.jpg)