Pyramid Diagram
The Project Management Triangle Diagram depicts three main constraints of any project: scope, time and cost. Projects have to comply with the specified scope, projects should be finished in time and projects need to consume the budget. Each of the constraints represents one side of the triangle, and any change in budget or timing or scope affects the entire diagram.Project — Assigning Resources
Users new to ConceptDraw PROJECT will find the Basic lessons an essential platform for familiarizing themselves with the program′s functions. Learn how to assign resources to tasks in ConceptDraw PROJECT with this comprehensive video lesson.Process Flowchart
ConceptDraw is Professional business process mapping software for making process flow diagram, workflow diagram, general flowcharts and technical illustrations for business documents. It is includes rich examples, templates, process flowchart symbols. ConceptDraw flowchart maker allows you to easier create a process flowchart. Use a variety of drawing tools, smart connectors, flowchart symbols and shape libraries to create flowcharts of complex processes, process flow diagrams, procedures and information exchange.
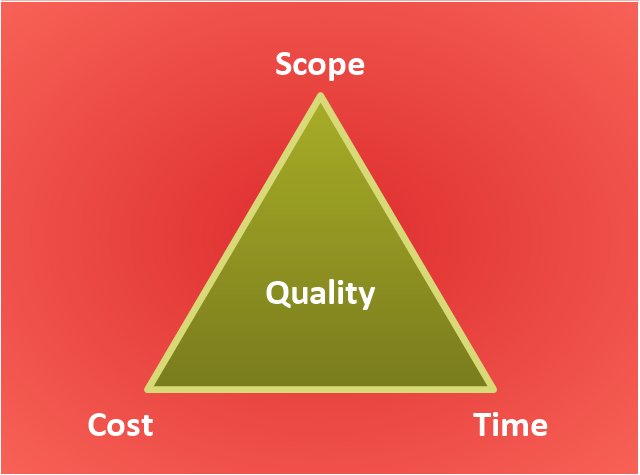
"The Project Management Triangle (called also Triple Constraint or the Iron Triangle) is a model of the constraints of project management. It is a graphic aid where the three attributes show on the corners of the triangle to show opposition. It is useful to help with intentionally choosing project biases, or analyzing the goals of a project. It is used to illustrate that project management success is measured by the project team's ability to manage the project, so that the expected results are produced while managing time and cost." [Project management triangle. Wikipedia]
The pyramid chart example "Project management triangle diagram" was redesigned using the ConceptDraw PRO diagramming and vector drawing software from Wikimedia Commons file Project-triangle-en.svg. [commons.wikimedia.org/ wiki/ File:Project-triangle-en.svg]
The project management triangle chart example is included in the Pyramid Diagrams solution from the Marketing area of ConceptDraw Solution Park.
Project Management Area
Project Management area provides Toolbox solutions to support solving issues related to planning, tracking, milestones, events, resource usage, and other typical project management functions.
Project — Working With Tasks
A full-featured project management solution with all the necessary functions right at your fingertips. Generates an extensive variety of reports on project and task statuses.These videos provide a series of lessons that will enhance the understanding of all our users, from people just starting out with the software, through to expert users.
How To Implement Collaborative Project Management
Collaborative Project Management via Skype is an ideal tool for project teams who need to master a growing project complexity.CORRECTIVE ACTIONS PLANNING. Risk Diagram (PDPC)
Risk Diagram (PDPC) - ConceptDraw Office suite is a software for Risks Diagram making. This diagram identifies possible risks in accomplishing corrective actions. With the Risks Diagram, one analyzes each action separately in a tree of all actions and develops a preventive action in response of each potential obstacles or circumstances which may be a risk.Venn Diagrams
Venn Diagrams are actively used to illustrate simple set relationships in set theory and probability theory, logic and statistics, mathematics and computer science, linguistics, sociology, and marketing. Venn Diagrams are also often used to visually summarize the status and future viability of a project.
HelpDesk
How to Create a Timeline Diagram in ConceptDraw PRO
A Timeline is a chart which displays a project plan schedule in chronological order. A Timeline is used in project management to depict project milestones and visualize project phases, and show project progress. The graphic form of a timeline makes it easy to understand critical project milestones, such as the progress of a project schedule. Timelines are particularly useful for project scheduling or project management when accompanied with a Gantt chart. It captures the main of what the project will accomplish and how it will be done. making a project timeline is one of the most important skills a project manager needs have. Making comprehensive, accurate timelines allows you getting every project off in the best way. ConceptDraw PRO allows you to draw a timeline charts using special library.Types of Flowchart - Overview
When designing a process or an instruction in clear way, you should consider creating a flowchart. A Process Flow Diagram is the method. You can avoid wasting a lot of time understanding complex concepts as they get clear with different diagrams.HelpDesk
How to Plan and Allocate Resources in Your Project with ConceptDraw PROJECT for Windows
Effective resource management is a key factor in the successful project implementation. The common types of resources for which the project manager has an impact, include material resources (materials, energy), staff (work) and equipment. CoceptDraw PROJECT provides easy ways to project Resources Management: Create a list of project resources and assign the right human resource, as well as the necessary material, or equipment to be used.- Green Marketing Management Diagram
- Green Area Design Software
- Project management - Design Elements | | | Clipart Project ...
- Green Building Floor Plan
- Conceptdraw.com: Mind Map Software, Drawing Tools | Project ...
- Draw Project Management Nodes
- Explain Project Management Life Cycle With Block Diagram
- Green Development Diagram
- Diagram Of It Project Management
- Project Management Diagram
- Software Work Flow Process in Project Management with Diagram ...
- Pyramid Diagram | Software Work Flow Process in Project ...
- Activities In A Project Management Software With Example Diagram
- ConceptDraw PROJECT Project Management Tool | Bar Diagrams ...
- Quality Project Management with Mind Maps | Project — Assigning ...
- Project Management | ConceptDraw.com
- Project Management Cycle Through A Block Diagram
- Gant Chart in Project Management | How To Create Restaurant ...
- Process Flowchart | Project management life cycle - Flowchart ...
- Green Marketing Strategy
- ERD | Entity Relationship Diagrams, ERD Software for Mac and Win
- Flowchart | Basic Flowchart Symbols and Meaning
- Flowchart | Flowchart Design - Symbols, Shapes, Stencils and Icons
- Flowchart | Flow Chart Symbols
- Electrical | Electrical Drawing - Wiring and Circuits Schematics
- Flowchart | Common Flowchart Symbols