 Plumbing and Piping Plans
Plumbing and Piping Plans solution extends ConceptDraw DIAGRAM software with samples, templates and libraries of pipes, plumbing, and valves design elements for developing of water and plumbing systems, and for drawing Plumbing plan, Piping plan, PVC Pipe plan, PVC Pipe furniture plan, Plumbing layout plan, Plumbing floor plan, Half pipe plans, Pipe bender plans.
 Critical Infrastructure Sectors
Critical Infrastructure Sectors solution for ConceptDraw DIAGRAM software provides a set of examples and vector stencil libraries for designing infographics and diagrams about means for the most efficient protection of critical infrastructure, energy sector, and rapid recovery in the case of disruptions. Illustrate your projects on the prevention of physical, environmental, and cyber threats, development of information technology and detection equipment. Improve your projects in communications, financial services, emergency services, homeland security, cybersecurity to solve critical issues efficiently and decrease the detrimental effects of disruptions on society and citizens. Show the results of testing new technologies and newest equipment for critical infrastructure protection and increasing resilience.
Business Tools Perceptual Mapping
This sample shows the Perceptual map. It was created in ConceptDraw DIAGRAM diagramming and vector drawing software using the Matrices Solution from the Marketing area of ConceptDraw Solution Park. Perception Mapping helps organizations measure and transform all aspects of their business, people and culture. Perception Mapping allows to represent the complex relationships graphically, helps identify potential problems of the organization and make the best decisions.
 Sustainable Development
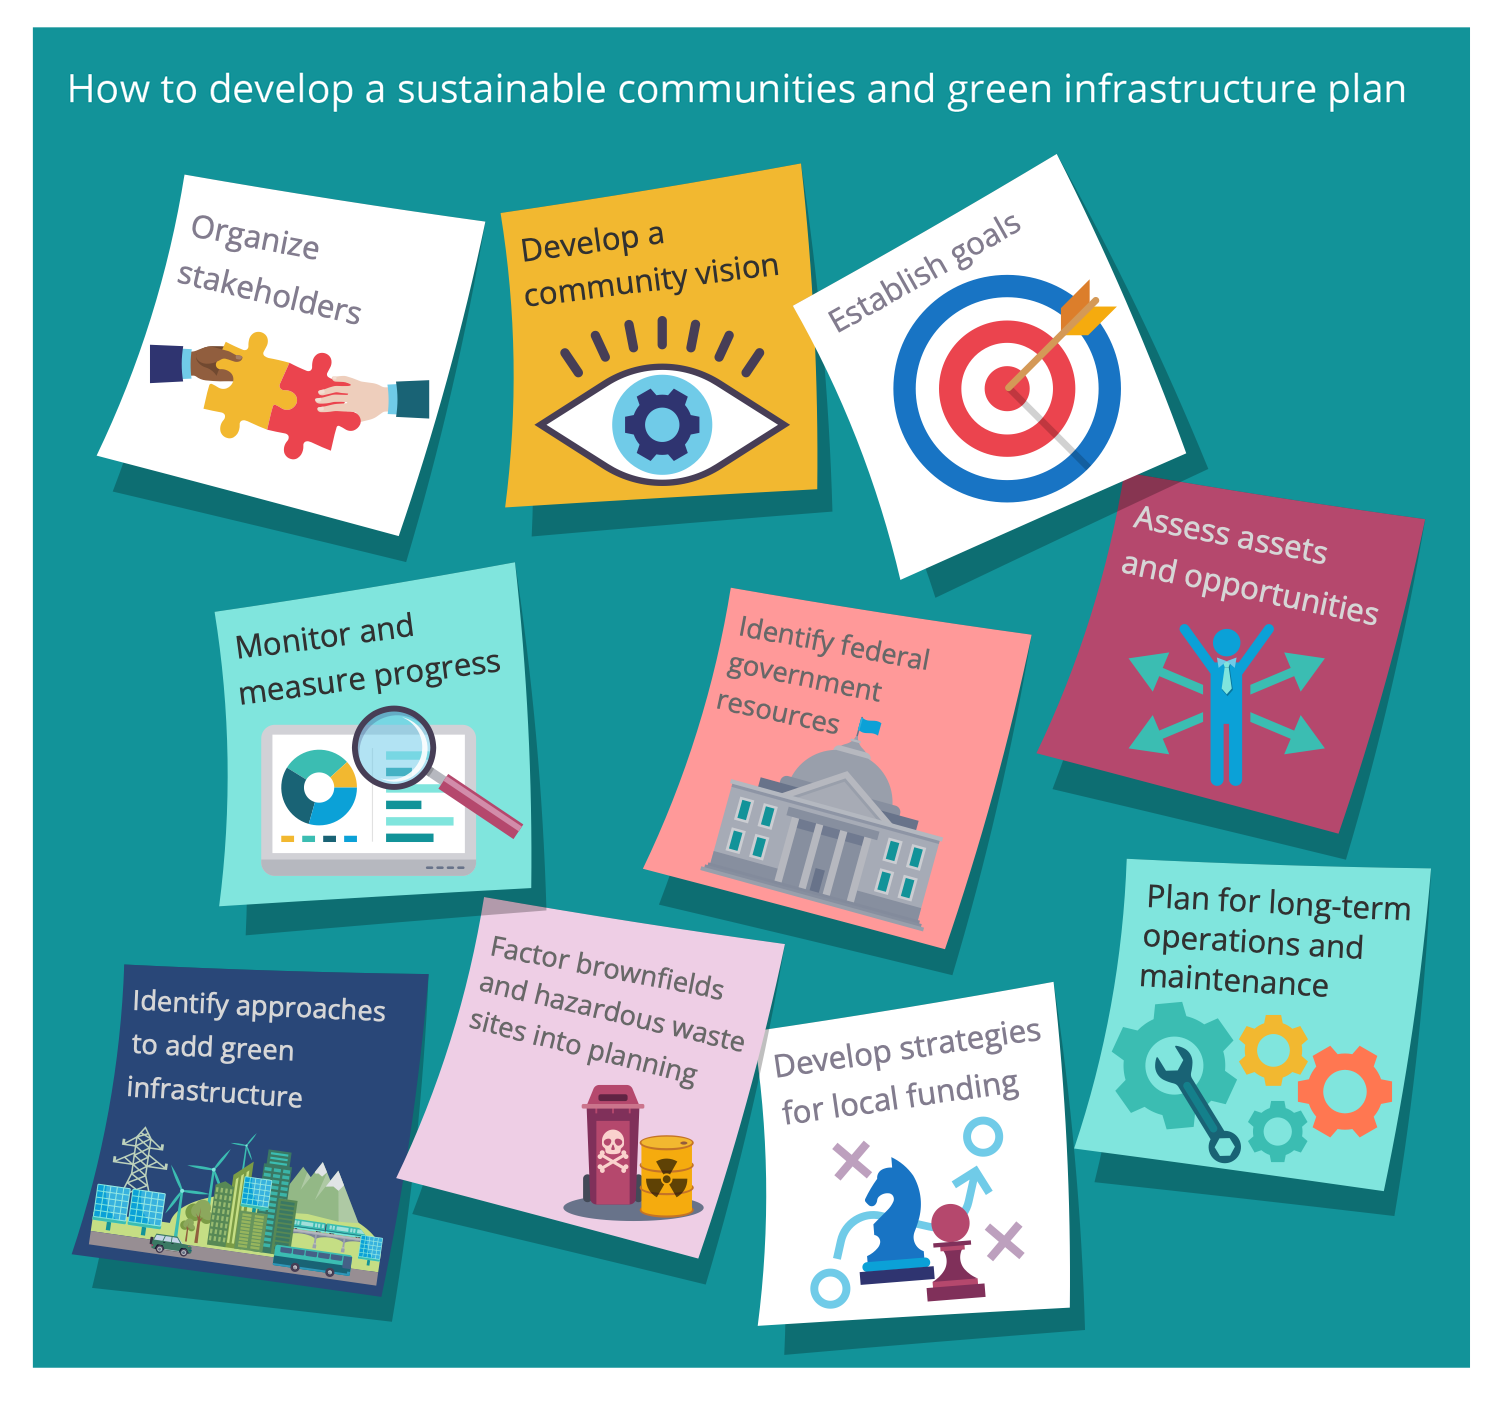
The Sustainable Development solution extends ConceptDraw DIAGRAM with a set of pre-made samples and a large collection of predesigned objects, symbols, and pictograms for designing professionally looking diagrams related to sustainable development, its processes, goals, methods, and ways for their achievement. This solution is really helpful to create schematics and designs illustrating the main points of sustainable development, social sustainability, narrating about sustainable energy and sources of green energy. It is useful to develop sustainable development plans that need to be implemented to ensure the safety of nature, list the UN sustainable development goals, draw up a plan for building a smart city and implementing the principles of sustainable agriculture, and other important information.
 Environmental, Social, and Corporate Governance
The Environmental, Social, and Corporate Governance solution with diversity of drawing tools, libraries of pre-made vector elements, and thematic samples is the best to illustrate the key points of ESG, specify ESG criteria and ESG risks. This helps investors evaluate potential investments and avoid investment losses. Outline ESG factors and ESG standards to protect the environment, avoid climate change and biodiversity loss, illustrate principles of sustainability, waste management, supply chain management, and the importance of the use of renewable energy and renewable resources. Depict easily the policies of the companies that adhere to ESG standards.
 HVAC Plans
Use HVAC Plans solution to create professional, clear and vivid HVAC-systems design plans, which represent effectively your HVAC marketing plan ideas, develop plans for modern ventilation units, central air heaters, to display the refrigeration systems for automated buildings control, environmental control, and energy systems.
 Green Energy
Green Energy solution extends the ConceptDraw DIAGRAM functionality with a large collection of vector design icons, pictograms, and clipart useful to design green energy infographics and illustrations of any kind. Create overview infographics about solar power, wind power, hydropower, tidal power and other renewable and cleaner energy sources. Compare visually different types of energy or data over several years in one chart. Develop detailed infographics about power generation mechanisms, how do solar panels work, wind and tidal turbines, and more specialized power generation equipment.
Geo Map — Europe — Germany
The vector stencils library Germany contains contours for ConceptDraw DIAGRAM diagramming and vector drawing software. This library is contained in the Continent Maps solution from Maps area of ConceptDraw Solution Park.
 Internet of Things
The Internet of Things solution extends ConceptDraw DIAGRAM with a set of samples and a wide collection of predesigned special clipart, pictograms, and symbols of IoT sensors, IoT devices, smart appliances, retail, industrial, and agricultural IoT devices, and many other IoT objects. This solution is incredibly helpful for designing the Internet of Things (IoT) and Web of Things (WoT) diagrams and infographics of different complexity for numerous areas and industries. It is incredibly useful for engineers, designers, electricians, mechanics, developers, technicians, electronics, and safety-related specialists.
 Landscape & Garden
The Landscape and Gardens solution for ConceptDraw DIAGRAM is the ideal drawing tool when creating landscape plans. Any gardener wondering how to design a garden can find the most effective way with Landscape and Gardens solution.
 Power Сircuits
The Power Circuits solution for ConceptDraw DIAGRAM is designed for drawing power electrical circuits, power grids, power generation, transformation, transmission, and distribution systems. It includes a set of samples and a large number of generally accepted electrical circuit symbols that guarantee clarity and simple comprehension of diagrams. The electrical symbols of transformers, motor starters, power stations, electric generators, electrical motors, windings connections, transmission lines, and more equipment are included. Use this solution to successfully create the Power Circuit Diagram of any complexity, display the functional parts of the electrical circuit and connections between them, electrical connections in substations, explain the principles of operation of electrical and power mechanisms, one-phase and three-phase power generation, create specifications of power electrical equipment.
Pyramid Diagram
Pyramid chart example is included in the Pyramid Diagrams solution from Marketing area of ConceptDraw Solution Park.Making Mechanical Diagram
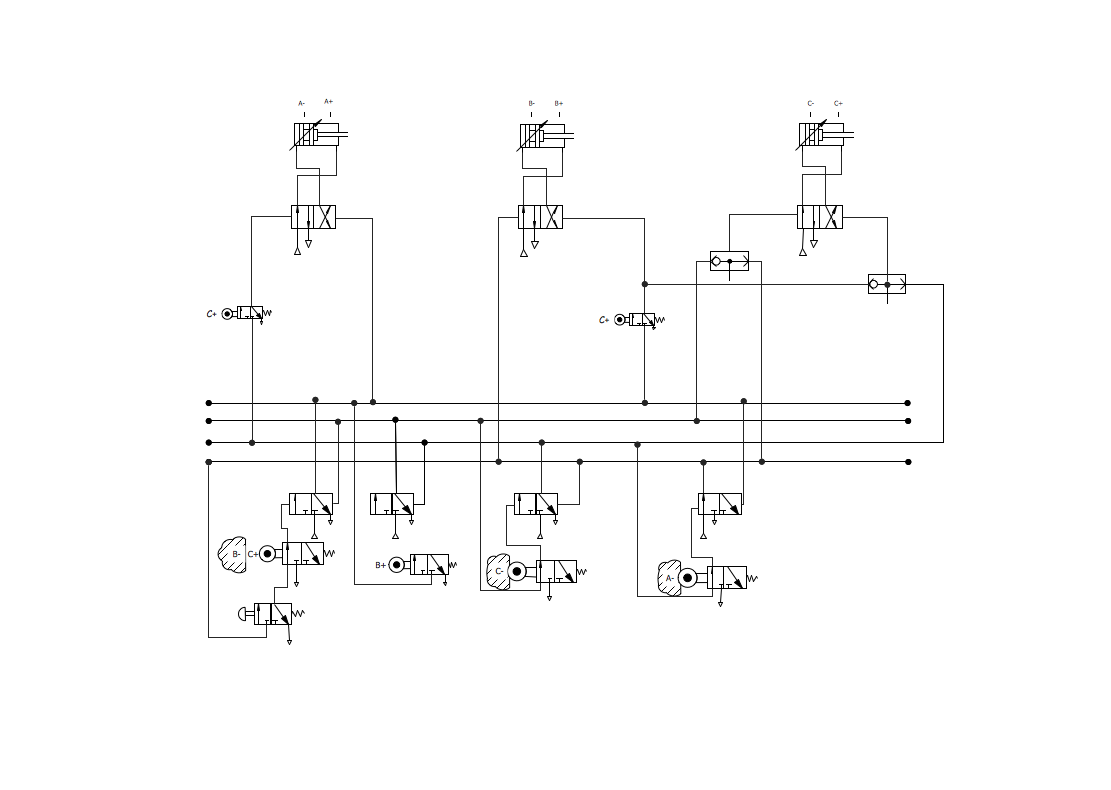
The engineering diagrams produced with ConceptDraw DIAGRAM are vector graphic documents and are available for reviewing, modifying, and converting to a variety of formats (image, HTML, PDF file, MS PowerPoint Presentation, Adobe Flash or MS Visio XML).
 Medical Mycology
The Medical Mycology solution for ConceptDraw DIAGRAM software provides a huge collection of vector design elements and a set of ready-made samples. It is effective for compiling an overview of fungal diseases, their etiological agents, identifying the diversity of fungal pathogens, mold, fungal mycotoxins, their role in systemic diseases. They help to describe the results of research in the field of medical mycology and immunology, the latest advances in the development of antifungal drugs, diagnosing fungal diseases and treating mycosis, fungal meningitis, tell about dangerous effects of fungi on humans and animals, personal hygiene and other ways to avoid infection, and the importance of complex antifungal therapy and immunotherapy.
Think. Act. Accomplish.
ConceptDraw MINDMAP is ready to provide you with mind mapping tool which can serve as comprehensive productivity tool for your business.
 Health Package
Health Package is a set of multifaceted solutions intended for visualization and illustration in a field of medicine and health, for drawing colorful, interesting and precise illustrations and infographics that will be used successfully in medical documents, articles, special magazines, posters, billboards, websites, presentations, collages. Having these solutions available, it will not be difficult to illustrate the medical editions, to convey the information in a full and interesting form, to teach students with use effective visual methods, to describe the medical facts, to tell about innovations in a field of medicine, health and correct nutrition, to explain the causes and consequences of different diseases, as well as the measures of their prevention and treatment.
 Chemical and Process Engineering
Extending the ConceptDraw DIAGRAM diagramming and drawing software with process flow diagram symbols, samples, process diagrams templates and libraries of design elements for creating process and instrumentation diagrams, block flow diagrams, process flow diagrams, and piping and instrumentation diagrams for chemical and process engineering, the Chemical and Process Engineering solution can be used by both chemical and project engineers, as well as the chemists for creating the needed drawings.
F&B
High competition among the restaurants at the food court requires original design ideas. To attract visitors and increase sales are used many kinds of advertising products, brightly colored signboards, menus and show-cases, often are used the molds of beautifully decorated dishes. Now designing of colorful F&B (food and beverage) materials is easier than ever thanks to the ConceptDraw DIAGRAM diagramming and vector drawing software extended with Food Court Solution from the Food and Beverage Area of ConceptDraw Solution Park.Tidal Power
Tidal power is a kind of energy produced by the natural rise and fall of ocean tides and currents. These tides are caused by the gravitational interaction between the Earth, the sun, and the moon. Succeed in designing visual infographics and diagrams about tidal power using ConceptDraw's Green Energy solution and Tidal Power library with a large variety of thematic vector design elements. This solution helps to make an overview of all variety of renewable resources, their advantages, and achievements from their use.Green Energy
Green energy is the type of energy generated from natural resources most of which are renewable. It is sunlight, wind, water, geothermal heat, tides, rain, biomass. Green energy has great advantages, it is environmentally friendly, doesn’t harm nature and climate. There is no release of greenhouse gases into the atmosphere at its use. The Sustainable Development solution for ConceptDraw DIAGRAM software includes samples and libraries of vector design stencils for creating illustrative and professional-looking diagrams and infographics to show green energy sources, their advantages, efficiency, costs, and wastes.- A Typical Ground Floor Plan Of Pure Water Factory
- Quick Recipes | Building Plan For Pure Water Factory Ground Floor ...
- Factory layout floor plan | Ground Floor Plan Of A Water Factory
- Electrical Design And Wiring Of A Pure Water Factory
- Water Factory Wiring
- Plumbing and Piping Plans | Sample Of Water Factory Ground Floor ...
- Factory layout floor plan | Ground Floor Plan For Factory
- | Floors Plan Of Pure Water Factory
- Floor Plan Of A Pure Water Factory
- Pure Water Factory Complete Architectural Drawing


