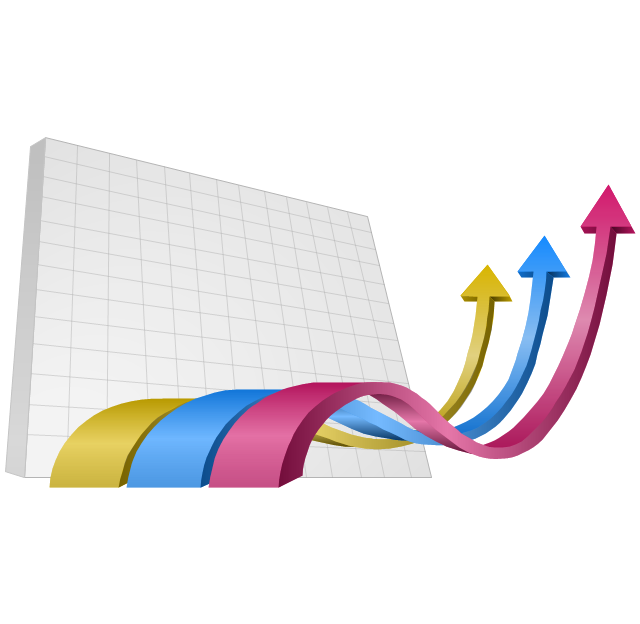
The vector clipart library "Presentation design elements" contains 45 presentation symbols and arrows which you can easy use in your slides and illustrations.
"A presentation is the process of presenting a topic to an audience. It is typically a demonstration, lecture, or speech meant to inform, persuade, or build good will. ... the use of visuals reduced meeting times... audiences believe presenters who use visuals are more professional and credible than presenters who merely speak. ... meetings and presentations reinforced with visuals help participants reach decisions and consensus more quickly." [Presentation. Wikipedia]
The clip art example "Presentation design elements - Vector clipart library" was created in the ConceptDraw PRO diagramming and vector drawing software using the Presentation Clipart solution from the Illustration area of ConceptDraw Solution Park.
 Picture Graphs
Typically, a Picture Graph has very broad usage. They many times used successfully in marketing, management, and manufacturing. The Picture Graphs Solution extends the capabilities of ConceptDraw PRO v10 with templates, samples, and a library of professionally developed vector stencils for designing Picture Graphs.
Basketball Defense Drills
The Basketball solution for ConceptDraw PRO includes a wide collection of templates and samples to help you draw any basketball-related diagrams and schemas as quickly as possible. All templates are ready-to-modify. You can start from any of them, change positions, add vector clipart from the libraries, text and thus get ready diagram in some clicks.Use the Best FlowChart Tool for the Job
The ConceptDraw PRO is a best flow chart tool for the job. The samples and templates included in the basic set allows users to draw any type of a flowchart. The vector stencils created by designers give ability to draw great-looking flowchart. Flowcharts give to users the ability to represent structural data visually.
 Matrices
This solution extends ConceptDraw PRO software with samples, templates and library of design elements for drawing the business matrix diagrams.
 Basic Line Graphs
This solution extends the capabilities of ConceptDraw PRO v10.3.0 (or later) with templates, samples and a library of vector stencils for drawing Line Graphs.
 Basic Area Charts
This solution extends the capabilities of ConceptDraw PRO v10.3.0 (or later) with templates, samples and a library of vector stencils for drawing Area Charts (area graphs) that visualize changes in values by filling in the area beneath the line connecting data points.
BCG Matrix
The growth–share matrix (BCG Matrix) was created by Bruce D. Henderson for the Boston Consulting Group in 1970 to help corporations to analyze their business units and to help the company allocate resources. How is it easy design the BCG Matrices in ConceptDraw PRO diagramming and vector drawing software supplied with unique Matrices Solution from the Marketing Area of ConceptDraw Solution Park.
 Frequency Distribution Dashboard
Frequency distribution dashboard solution extends ConceptDraw PRO software with samples, templates and vector stencils libraries with histograms and area charts for drawing the visual dashboards showing frequency distribution of data.
 Football
The Football Solution extends ConceptDraw PRO v9.5 (or later) software with samples, templates, and libraries of vector objects for drawing football (American) diagrams, plays schemas, and illustrations. It can be used to make professional looking documen
 Computer and Networks Area
The solutions from Computer and Networks Area of ConceptDraw Solution Park collect samples, templates and vector stencils libraries for drawing computer and network diagrams, schemes and technical drawings.
 PM Dashboards
This solution extends ConceptDraw PRO and ConceptDraw PROJECT software with the ability to clearly display the identified key performance indicators for any project.
- Presentation Clipart | Presentation design elements - Vector clipart ...
- Arrows - Vector clipart library | Presentation Clipart | Illustration ...
- Design elements - Arrows | Illustration | Arrows - Vector clipart library ...
- Presentation design elements - Vector clipart library | Presentation ...
- Presentation design elements - Vector clipart library | Presentation ...
- Arrows - Vector clipart library | Presentation Clipart | Design ...
- Presentation Clipart | Business People Clipart | Clipart School | Clip Art
- Presentation design elements - Vector clipart library | Presentation ...
- Marketing Plan Infographic | Presentation design elements - Vector ...
- Presentation design elements - Vector clipart library | Presentation ...
- Illustration | Presentation Clipart | Basic Flowchart Symbols and ...
- Presentation design elements - Vector clipart library | Presentation ...
- Arrow Process Clip Art
- Winter Sports Vector Clipart . Medal Map. Spatial Infographics ...
- Presentation Clipart | Presentation design elements - Vector clipart ...
- Presentation Clipart | Holiday | Business People Clipart | Solution ...
- Arrows - Vector clipart library | Presentation design elements ...
- Presentation design elements - Vector clipart library | Presentation ...
- Presentation Clipart | Business People Clipart | Business and ...
- Population Growth Clipart
