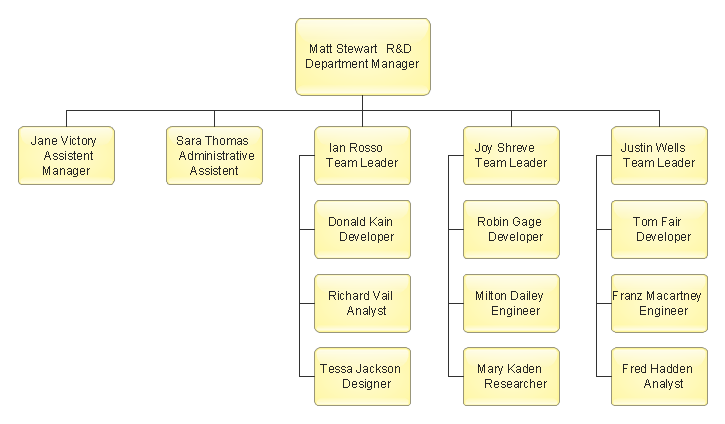
Organizational Chart
Organizational Chart is useful and perspective tool, which helps to illustrate the structure of an organization and relationships between personnel or departments. It is simple, but at the same time capacious graphical representation. ConceptDraw MINDMAP software is powerful in questions of brainstorming, designing Mind Maps and Organizational Charts, making professional presentations, building effective strategies, preparing documents and conducting meetings. ConceptDraw Office applications allow create Organizational Chart from your map in one click. Use numerous advantages of hierarchical tree structure of Mind Map when developing the organizational structure of your organization. Pay also attention on helpful Business Productivity solutions supported by ConceptDraw Solution Park, which assist managers and knowledge workers in making their jobs easier and save their time. The flexibility of ConceptDraw Office and the use of content that has already been developed and offered by ConceptDraw Solution Park as well as ability to repurpose it according to your requirements, help you effectively respond to any eventuality.BCG Matrix
The growth–share matrix (BCG Matrix) was created by Bruce D. Henderson for the Boston Consulting Group in 1970 to help corporations to analyze their business units and to help the company allocate resources. How is it easy design the BCG Matrices in ConceptDraw DIAGRAM diagramming and vector drawing software supplied with unique Matrices Solution from the Marketing Area of ConceptDraw Solution Park.Organizational Structure Types
There are three main types of organizational structures which can be adopted by organizations depending on their objectives: functional structure, divisional structure, matrix structure. ConceptDraw DIAGRAM diagramming and vector drawing software enhanced with 25 Typical Orgcharts solution from the Management area of ConceptDraw Solution Park is ideal for designing diagrams and charts of any organizational structure types.Remote Projects in Corporate Strategy
Communication is the main challenge and the key success factor for organizational project management in company with remote projects. Communicating visually via Skype you bring all projects together to achieve corporate goals.
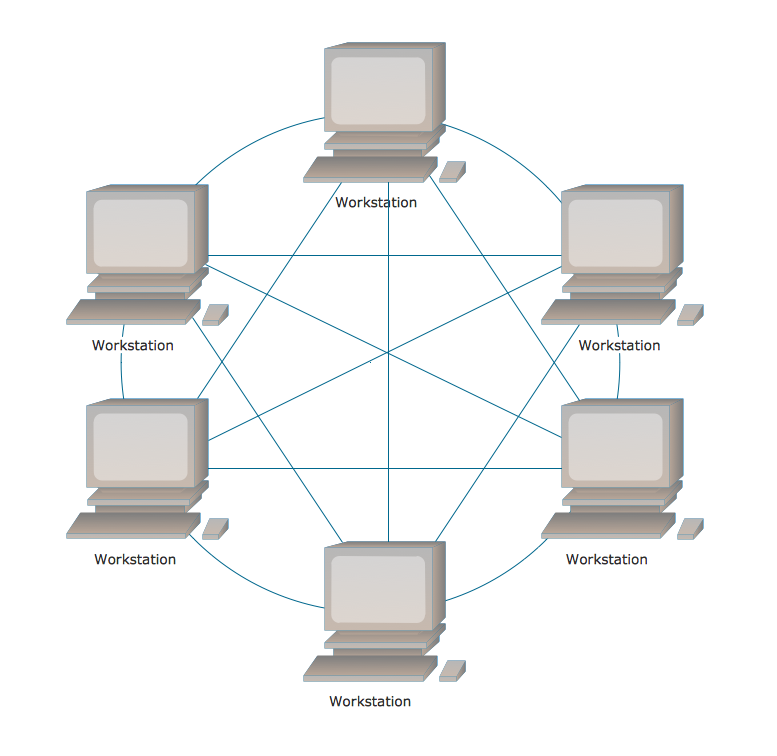
Fully Connected Network Topology Diagram
Fully Connected Network Topology (Complete topology, Full mesh topology) is a network topology characterized by existence of direct links between all pairs of nodes. The Fully connected network including n nodes, contains n(n-1)/2 direct links. This topology is mostly used in military applications. It is a quite expensive network technology and is extremely impractical for the large networks. But when it is set, it provides a high degree of reliability thanks to the large quantity of redundant links between nodes and so multiplicity of paths for the data. The two-node network is also considered as a Fully connected network. Computer Network Diagrams solution from Computer and Networks area of ConceptDraw Solution Park offers the predesigned vector stencils libraries, examples and templates for easy designing various Computer network topology diagrams for wired and wireless networks, including the Fully connected topology. This solution is intended to help computer network designers and engineers perfectly illustrate network documentation, reports, presentations, etc.Human Resources
Human resources is the set of individuals who make up the workforce of an organization, business sector, or economy. ConceptDraw DIAGRAM diagramming and vector drawing software extended with unique HR Flowcharts Solution from the Management Area of ConceptDraw Solution Park is the best for designing various flowcharts and diagrams in the field of human resources management.Line Chart Examples
The Line Graphs solution from Graphs and Charts area of ConceptDraw Solution Park contains a set of examples, templates and design elements library of line and scatter charts. Use it to draw line and scatter graphs using ConceptDraw DIAGRAM diagramming and vector drawing software for illustrating your documents, presentations and websites.Matrices
ConceptDraw DIAGRAM extended with Matrices Solution from the Marketing Area of ConceptDraw Solution Park is a powerful software for drawing various types of Marketing Matrices: Ansoff Matrix, BCG Matrix, Deployment Chart, Feature Comparison Chart, Competitive Strategies Matrix, Flow Process Chart, Porter's Value Chain Diagram, Positioning Map, and many others.SWOT Analysis Software
SWOT analysis is a powerful tool that helps the business professionals to identify the positives and negatives within an organization and in an external environment. TOWS is a variation of SWOT analysis, more focused on external factors and action planning. The correct and full awareness of the situation is important for strategic planning, as well as for decision making and coordination the company's resources and information capabilities of the competitive environment. SWOT and TOWS Matrix Diagrams solution included to ConceptDraw Solution Park makes the ConceptDraw DIAGRAM a powerful SWOT Analysis software and provides a lot of advantages. First of all note the set of ready-made templates that help to identify the Strengths, Weaknesses, Opportunities, and Threats the most quickly and effectively, and the choice of outputs to present the analysis results as SWOT or TOWS matrix. The well-designed SWOT matrix samples and examples included to SWOT and TOWS Matrix Diagrams solution illustrate the results you can achieve using it and also can be used as a good start for your own matrices.- Sales Growth . Bar Graphs Example | Organizational Chart ...
- Sales Growth . Bar Graphs Example | Marketing and Sales ...
- Business Report Pie. Pie Chart Examples | Example of ...
- Follow Up Chart
- 4 Level pyramid model diagram - Information systems types ...
- Matrix Organization Structure | Authority Matrix Diagram Software ...
- Employee distribution - HR dashboard | Frequency Distribution ...
- Sales Growth . Bar Graphs Example | Bar Diagrams for Problem ...
- Create Graphs and Charts | Sales Growth . Bar Graphs Example ...


