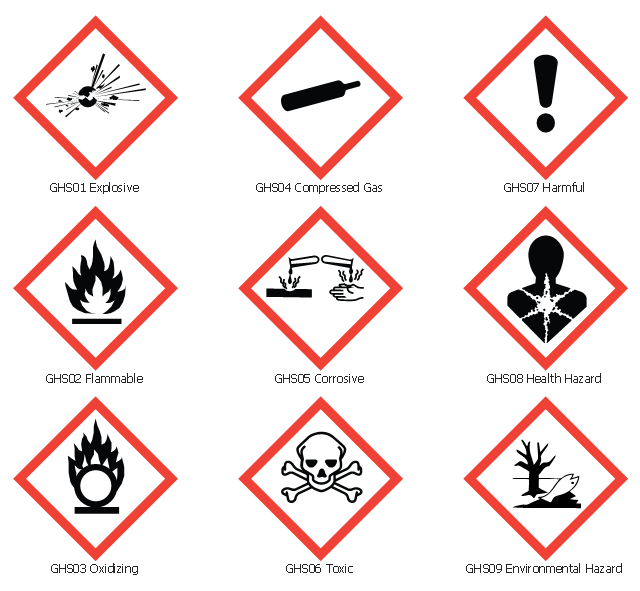
The vector stencils library "GHS hazard pictograms" contains 9 chemical hazard symbols.
Use it in ConceptDraw PRO software to design your chemical safety infographics, labels of containers with hazardous materials, International Chemical Safety Cards (ICSC), manufacturers' Safety Data Sheets (SDS), and Material Safety Data Sheets (MSDS).
"Hazard pictograms form part of the international Globally Harmonized System of Classification and Labelling of Chemicals (GHS). Two sets of pictograms are included within the GHS: one for the labelling of containers and for workplace hazard warnings, and a second for use during the transport of dangerous goods. ...
Hazard pictograms are one of the key elements for the labelling of containers under the GHS, along with:
- an identification of the product;
- a signal word – either Danger or Warning – where necessary;
- hazard statements, indicating the nature and degree of the risks posed by the product;
- precautionary statements, indicating how the product should be handled to minimize risks to the user (as well as to other people and the general environment);
- the identity of the supplier (who might be a manufacturer or importer)." [GHS hazard pictograms. Wikipedia]
The chemical hazard symbols example "Design elements - GHS hazard pictograms" is included in the GHS Hazard Pictograms solution from the Engineering area of ConceptDraw Solution Park.
Fault Tree Analysis Software
ConceptDraw DIAGRAM extended with Fault Tree Analysis Diagrams Solution from the Industrial Engineering Area of ConceptDraw Solution Park is the best Fault Tree Analysis Software. First of all, Fault Tree Analysis Diagrams Solution provides a set of samples which are the good examples of easy drawing professional looking Fault Tree Analysis Diagrams.The vector stencils library "Fault tree analysis diagrams" contains 12 symbols for drawing Fault Tree Analysis (FTA) diagrams.
"Fault tree analysis (FTA) is a top down, deductive failure analysis in which an undesired state of a system is analyzed using Boolean logic to combine a series of lower-level events. This analysis method is mainly used in the fields of safety engineering and reliability engineering to understand how systems can fail, to identify the best ways to reduce risk or to determine (or get a feeling for) event rates of a safety accident or a particular system level (functional) failure. FTA is used in the aerospace, nuclear power, chemical and process, pharmaceutical, petrochemical and other high-hazard industries; but is also used in fields as diverse as risk factor identification relating to social service system failure.
In aerospace, the more general term "system Failure Condition" is used for the "undesired state" / Top event of the fault tree. These conditions are classified by the severity of their effects. The most severe conditions require the most extensive fault tree analysis. These "system Failure Conditions" and their classification are often previously determined in the functional Hazard analysis." [Fault tree analysis. Wikipedia]
The shapes example "Fault tree analysis diagrams" was created using the ConceptDraw PRO diagramming and vector drawing software extended with the Fault Tree Analysis Diagrams solution from the Engineering area of ConceptDraw Solution Park.
 Business Process Workflow Diagrams
The Business Process Workflow Diagrams solution enhances the ConceptDraw DIAGRAM functionality with predesigned examples, samples and a numerous collection of predesigned vector objects of workflow chart elements, icons, arrows, connectors, and varied wor
 Flowcharts
The Flowcharts solution for ConceptDraw DIAGRAM is a comprehensive set of examples and samples in several varied color themes for professionals that need to represent graphically a process. Solution value is added by the basic flow chart template and shapes' libraries of flowchart notation. ConceptDraw DIAGRAM flow chart creator lets one depict the processes of any complexity and length, as well as design the Flowchart either vertically or horizontally.
 Business and Finance
Use Business and Finance solution to make professional-looking documents, presentations and websites, business, finance, advertising, and project management illustrations, or any designs that requires clipart of currency, office, business, advertising, management, marketing, people, time, post, contacts, collaboration, etc.
 Scrum Workflow
The Scrum Workflow Solution extends the capabilities of ConceptDraw DIAGRAM with a large collection of professionally-designed samples and a selection of ready-to-use scrum design elements: scrum diagrams and arrows, scrum icons of people, artifacts, workflow, workspace and other colorful scrum clipart, and also scrum charts.
 IDEF Business Process Diagrams
Use the IDEF Business Process Diagrams solution to create effective database designs and object-oriented designs, following the integration definition methodology.
 Wireless Networks
The Wireless Networks Solution extends ConceptDraw DIAGRAM software with professional diagramming tools, set of wireless network diagram templates and samples, comprehensive library of wireless communications and WLAN objects to help network engineers and designers efficiently design and create Wireless network diagrams that illustrate wireless networks of any speed and complexity, and help to identify all required equipment for construction and updating wireless networks, and calculating their costs.
Interior Design. Office Layout Plan Design Element
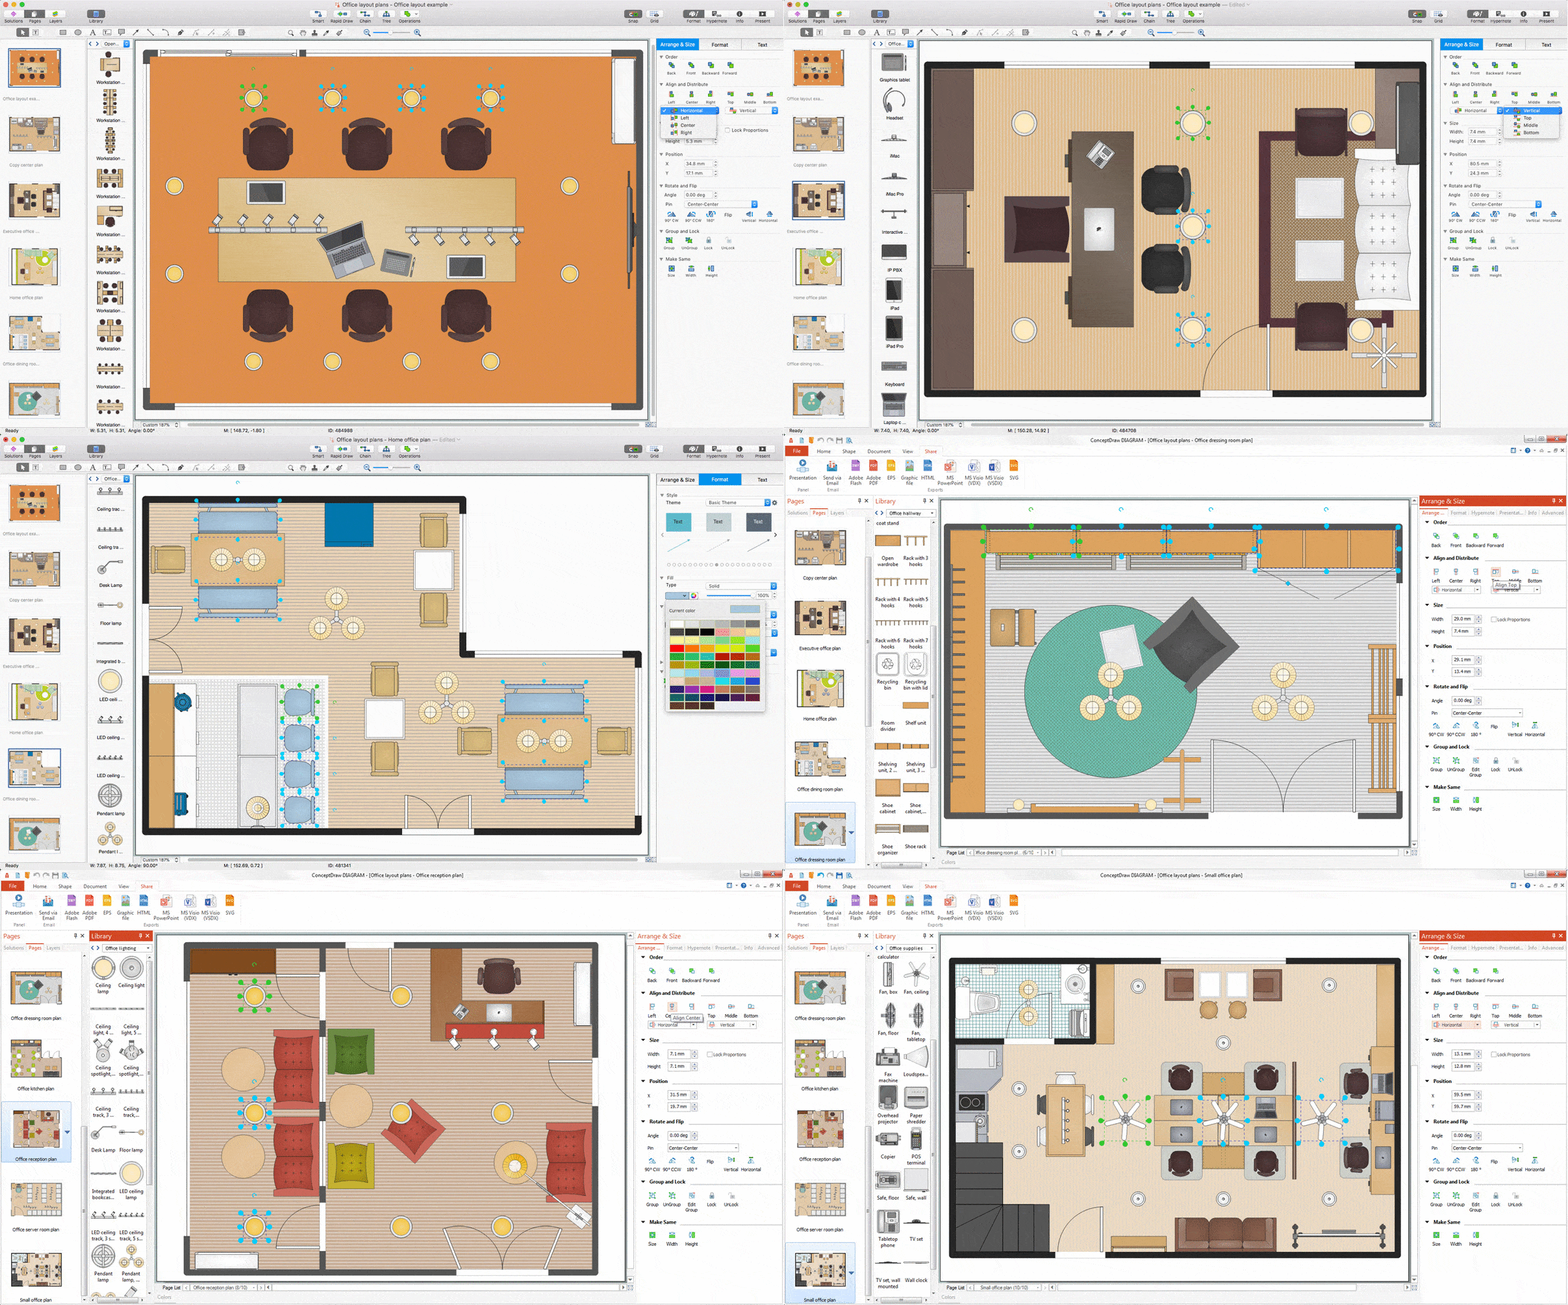
Lucky interior design is an integral part of succesful work at office. The important challenge in office design planning is to find a balance between two main office activities: concentration and communication. Primarily you need to determine with a type of office space, this can be an open space or separate rooms. The first type is more suitable for communication and rapid interaction. That's why open offices and combined spaces are modern types of work space and often used, especially for private offices. Traditional office basically represents separate rooms arranged along the corridor. It is applied for the companies with small number of people or for enterprises divided on separate departments, and is practically inapplicable for teamwork. ConceptDraw DIAGRAM diagramming and vector drawing software extended with Office Layout Plans solution offers a lot of vector stencils libraries with design elements of office furniture and equipment for effective office interior design and office space planning, for easy creation Office Floor Plans and Office Layout Plans. Use ConceptDraw DIAGRAM to visualize process flowcharts, network architecture and program workflows like Visio for Mac and even more. The software can be used with different fields like business, engineering and construction, etc.
 ATM UML Diagrams
The ATM UML Diagrams solution lets you create ATM solutions and UML examples. Use ConceptDraw DIAGRAM as a UML diagram creator to visualize a banking system.
 Ice Hockey
The Ice Hockey Solution extends the capabilities of ConceptDraw DIAGRAM.5 (or later) with samples, templates, and libraries of vector objects for drawing hockey diagrams, plays schemas, and illustrations. The Ice Hockey Solution can be used to make polishe
 Floor Plans
Construction, repair and remodeling of the home, flat, office, or any other building or premise begins with the development of detailed building plan and floor plans. Correct and quick visualization of the building ideas is important for further construction of any building.
- New GHS Hazard Solution for ConceptDraw PRO v11
- FTA diagram - Hazard analysis | Accident analytic tree - FTA ...
- FTA diagram - Hazard analysis | Design elements - Fault tree ...
- GHS Hazard Pictograms | Transport Hazard Pictograms | Hazard ...
- Ghs Hazard Symbol Ghs07
- GHS Hazard Pictograms | GHS Label Pictograms | Design elements ...
- Import process - Flowchart | Transport Hazard Pictograms | SWOT ...
- Transport Hazard Pictograms | Transport pictograms - Vector ...
- Sport pictograms. Olympic Games | GHS Hazard Pictograms ...
- Fault Tree Analysis Diagrams | PROBLEM ANALYSIS. Root Cause ...
- Fault Tree Analysis Examples And Solutions
- Data Flow Diagrams | Design elements - Fault tree analysis ...
- Design elements - Fault tree analysis diagrams | Fault Tree Analysis ...
- Fault Tree Analysis Software | Design elements - Fault tree analysis ...
- What Is P Id
- Import process - Flowchart | SWOT Analysis | Transport Hazard ...
- Types of Flowcharts | Design elements - Fault tree analysis ...
- How To Create Emergency Plans and Fire Evacuation | Fire Exit ...
- Design elements - Fire and emergency planning | Piping and ...
- Design elements - Medicine and health pictograms | Medicine and ...


