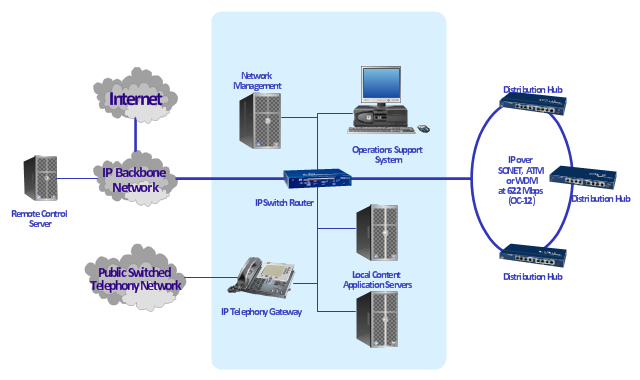
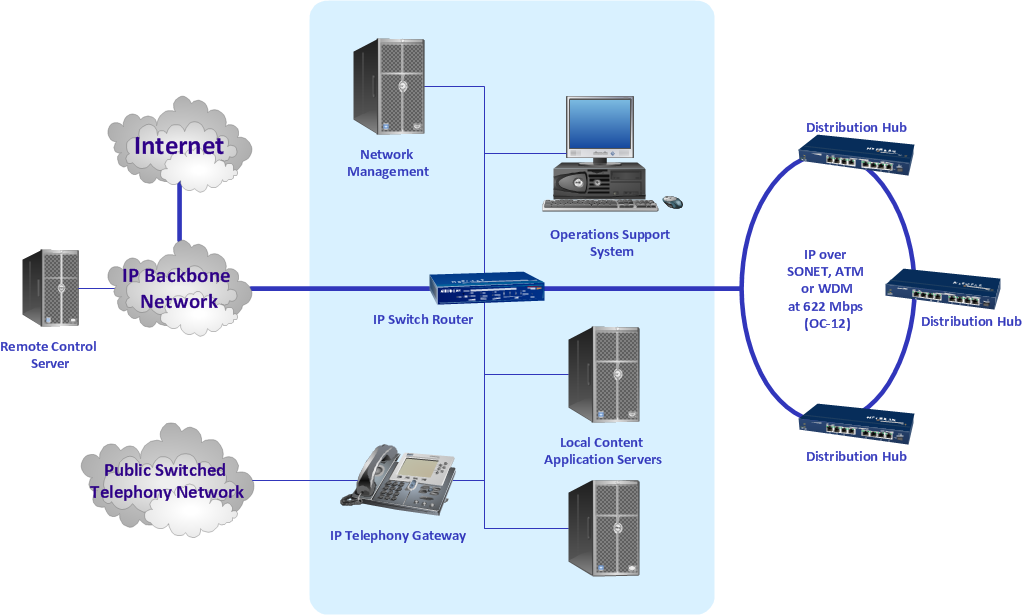
"A cable television headend is a master facility for receiving television signals for processing and distribution over a CATV system. The headend facility is normally unstaffed and surrounded by some type of security fencing and is typically a building or large shed housing electronic equipment used to receive and re-transmit video over the local cable infrastructure. One can also find head ends in power line communication (PLC) substations and Internet communications networks." [Cable television headend. Wikipedia]
This regional cable head-end diagram example was created using the ConceptDraw PRO diagramming and vector drawing software extended with the Computer and Networks solution from the Computer and Networks area of ConceptDraw Solution Park.
This regional cable head-end diagram example was created using the ConceptDraw PRO diagramming and vector drawing software extended with the Computer and Networks solution from the Computer and Networks area of ConceptDraw Solution Park.
Draw Diagram Software
Entity Relationship Diagram (aka ERD, ER Diagram , E-R Diagram ) is a well-tried Professional ERD drawing and is an essential software engineering method for data visualization. All you need to start draw your diagram is to choose any type of template.Basic Network Diagram
The Basic Network Diagram is an easy and effective way to design and document a simple network, it lets to represent visually and logically how the different network devices and computer equipment can be installed to meet the main business needs. ConceptDraw DIAGRAM software supplied with Computer Network Diagrams solution from the Computer and Networks area of ConceptDraw Solution Park is a perfect tool for drawing the Basic Computer Network diagrams, designs, schematics, and maps, network architectures, topologies, and layouts. Numerous vector libraries of network symbols, icons and components are incredibly helpful for IT and telecom engineers, stakeholders and end-users when designing Basic Network Diagrams, Common Network Diagrams, Common Network Topologies, 10Base-T Star Network Topologies, Bus Topology Diagrams, Communication Network Diagrams, System Designs, Regional Cable Head-End Diagrams, etc. Collection of predesigned samples and templates included to Computer Network Diagrams solution also greatly extends the capabilities of ConceptDraw DIAGRAM users.
 Computer Network Diagrams
Computer Network Diagrams solution extends ConceptDraw DIAGRAM software with samples, templates and libraries of vector icons and objects of computer network devices and network components to help you create professional-looking Computer Network Diagrams, to plan simple home networks and complex computer network configurations for large buildings, to represent their schemes in a comprehensible graphical view, to document computer networks configurations, to depict the interactions between network's components, the used protocols and topologies, to represent physical and logical network structures, to compare visually different topologies and to depict their combinations, to represent in details the network structure with help of schemes, to study and analyze the network configurations, to communicate effectively to engineers, stakeholders and end-users, to track network working and troubleshoot, if necessary.
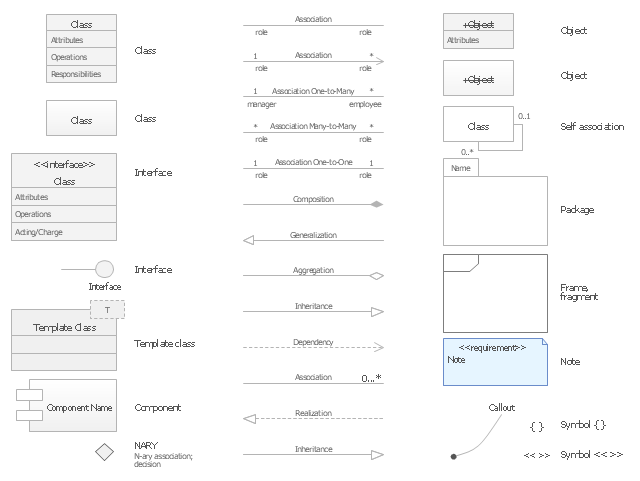
The vector stencils library "UML class diagrams" contains 38 symbols for the ConceptDraw PRO diagramming and vector drawing software.
"... classes are represented with boxes which contain three parts:
(1) The top part contains the name of the class. It is printed in Bold, centered and the first letter capitalized.
(2) The middle part contains the attributes of the class. They are left aligned and the first letter is lower case.
(3) The bottom part gives the methods or operations the class can take or undertake. They are also left aligned and the first letter is lower case. ...
To indicate a classifier scope for a member, its name must be underlined. ...
An association can be named, and the ends of an association can be adorned with role names, ownership indicators, multiplicity, visibility, and other properties. ...
Aggregation ... is graphically represented as a hollow diamond shape on the containing class end of the tree with a single line that connects the contained class to the containing class.
... graphical representation of a composition relationship is a filled diamond shape on the containing class end of the tree of lines that connect contained class(es) to the containing class.
... graphical representation of a Generalization is a hollow triangle shape on the superclass end of the line (or tree of lines) that connects it to one or more subtypes.
... graphical representation of a Realization is a hollow triangle shape on the interface end of the dashed line (or tree of lines) that connects it to one or more implementers. A plain arrow head is used on the interface end of the dashed line that connects it to its users.
Multiplicity ... representation of an association is a line with an optional arrowhead indicating the role of the object(s) in the relationship, and an optional notation at each end indicating the multiplicity of instances of that entity (the number of objects that participate in the association).
Entity classes ... are drawn as circles with a short line attached to the bottom of the circle. Alternatively, they can be drawn as normal classes with the «entity» stereotype notation above the class name." [Class diagram. Wikipedia]
The example "Design elements - UML class diagrams" is included in the Rapid UML solution from the Software Development area of ConceptDraw Solution Park.
 Fishbone Diagrams
The Fishbone Diagrams solution extends ConceptDraw DIAGRAM software with the ability to easily draw the Fishbone Diagrams (Ishikawa Diagrams) to clearly see the cause and effect analysis and also problem solving. The vector graphic diagrams produced using this solution can be used in whitepapers, presentations, datasheets, posters, and published technical material.
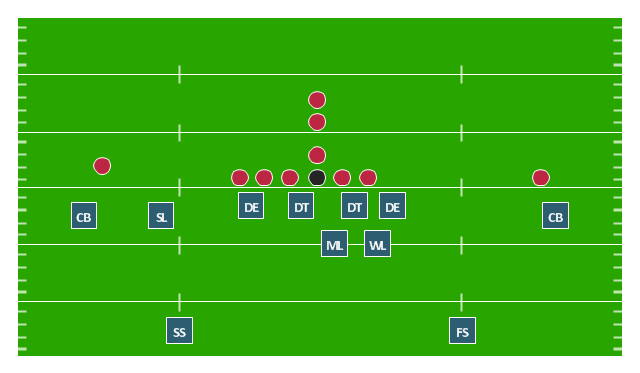
"In American football, a 4–3 defense is a defensive alignment consisting of four down linemen and three linebackers. It is probably the most commonly used defense in modern American football and especially in the National Football League. ...
In the original version of the 4–3, the tackles lined up over the offensive guards and the ends lined up on the outside shoulder of the offensive tackles, with the middle linebacker over the center and the other linebackers outside the ends. In the mid-1960s Hank Stram developed a popular variation, the "Kansas City Stack", which shifted the strong side defensive end over the tight end, stacked the strongside linebacker over the tackle, and shifted the weakside tackle over center. At about the same time the Cleveland Browns frequently used a weakside shift. The Dallas Cowboys coach Tom Landry developed a "flex" variation, in order to take advantage of the quickness of his Hall of Fame tackle, Bob Lilly. In Tom Landry's original 4–3 defenses (4-3 Inside and 4-3 Outside), both defensive tackle were flexed. In the "flex", on a pro set right, with defensive keys showing a run to the right, the right defensive tackle would be flush on the line and was supposed to penetrate. The right defensive end and left defensive tackle were flexed two feet off the line of scrimmage, the right defensive end now head on with the left offensive tackle (i.e. a 4-2-2-5 front instead of the more common 5-2-2-5 front). This gave the defense a "zig zag" look unlike any other of its day. More modern versions of the 4-3 include the Tampa 2 scheme and the 4-3 slide." [4–3 defense. Wikipedia]
The American football positions diagram example "Defensive play - Under front" was created using the ConceptDraw PRO diagramming and vector drawing software extended with the Football solution from the Sport area of ConceptDraw Solution Park.
- Regional cable head - end diagram | Basic Network Diagram | Draw ...
- Regional cable head - end diagram | Draw Diagram Software | Basic ...
- Regional cable head - end diagram
- Regional cable head - end diagram | Bus Network Diagram Plc
- Cable TV - Vector stencils library | Cable Tv Headend Diagram
- How To use House Electrical Plan Software | Regional cable head ...
- Regional cable head - end diagram | Mobile satellite TV network ...
- Schematic Diagram Catv Headend
- Regional cable head - end diagram | Local area network (LAN ...
- Daisy Chain Network Topology | Block Diagram | Regional cable ...
- Regional cable head - end diagram | Basic Network Diagram ...
- Communication network diagram | Regional cable head - end ...
- Cable TV - Vector stencils library | Cable Television Headend
- Regional cable head - end diagram | Basic computer network ...
- Bus network topology diagram | Basic computer network diagram ...
- Regional cable head - end diagram | Electrical circuits - Vector ...
- Design elements - Cisco WAN | Computer Network Diagrams ...
- Basic Network Diagram | Local area network (LAN). Computer and ...
- Catv System Diagram
- Substation Equipment With Diagram


