HelpDesk
How to Create Infographics that Help People Eat Healthy
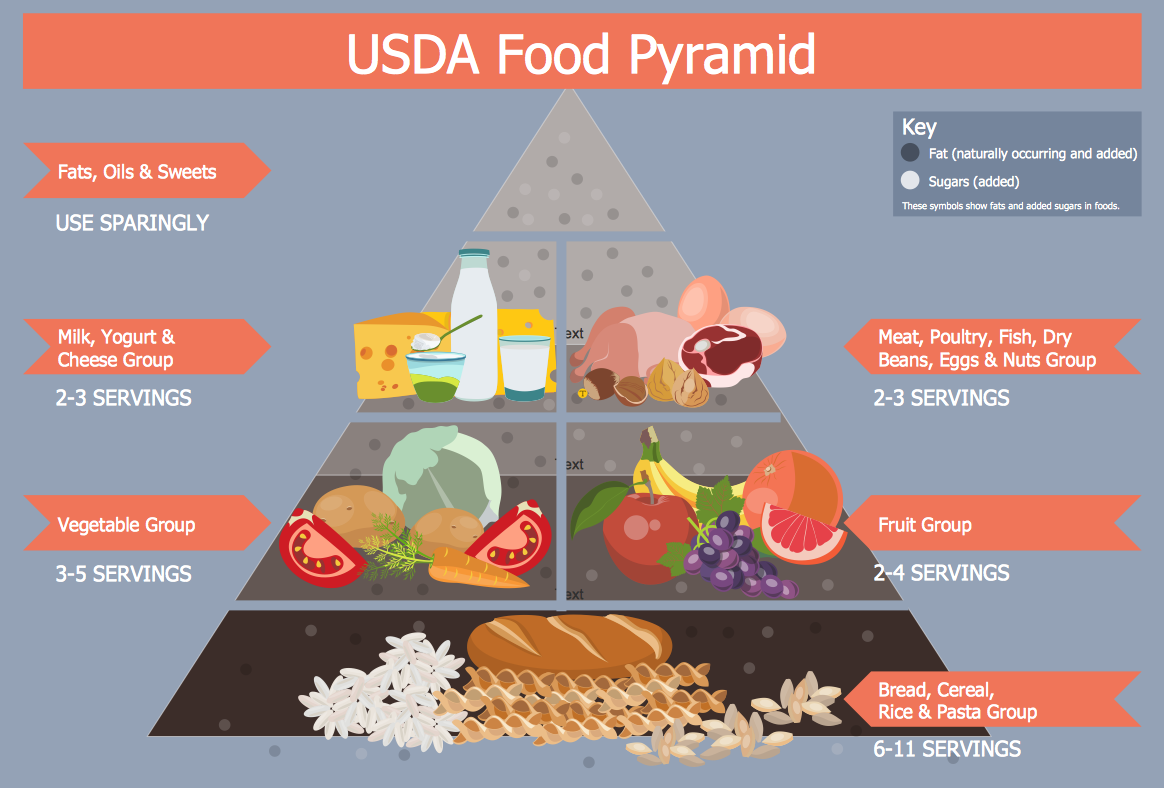
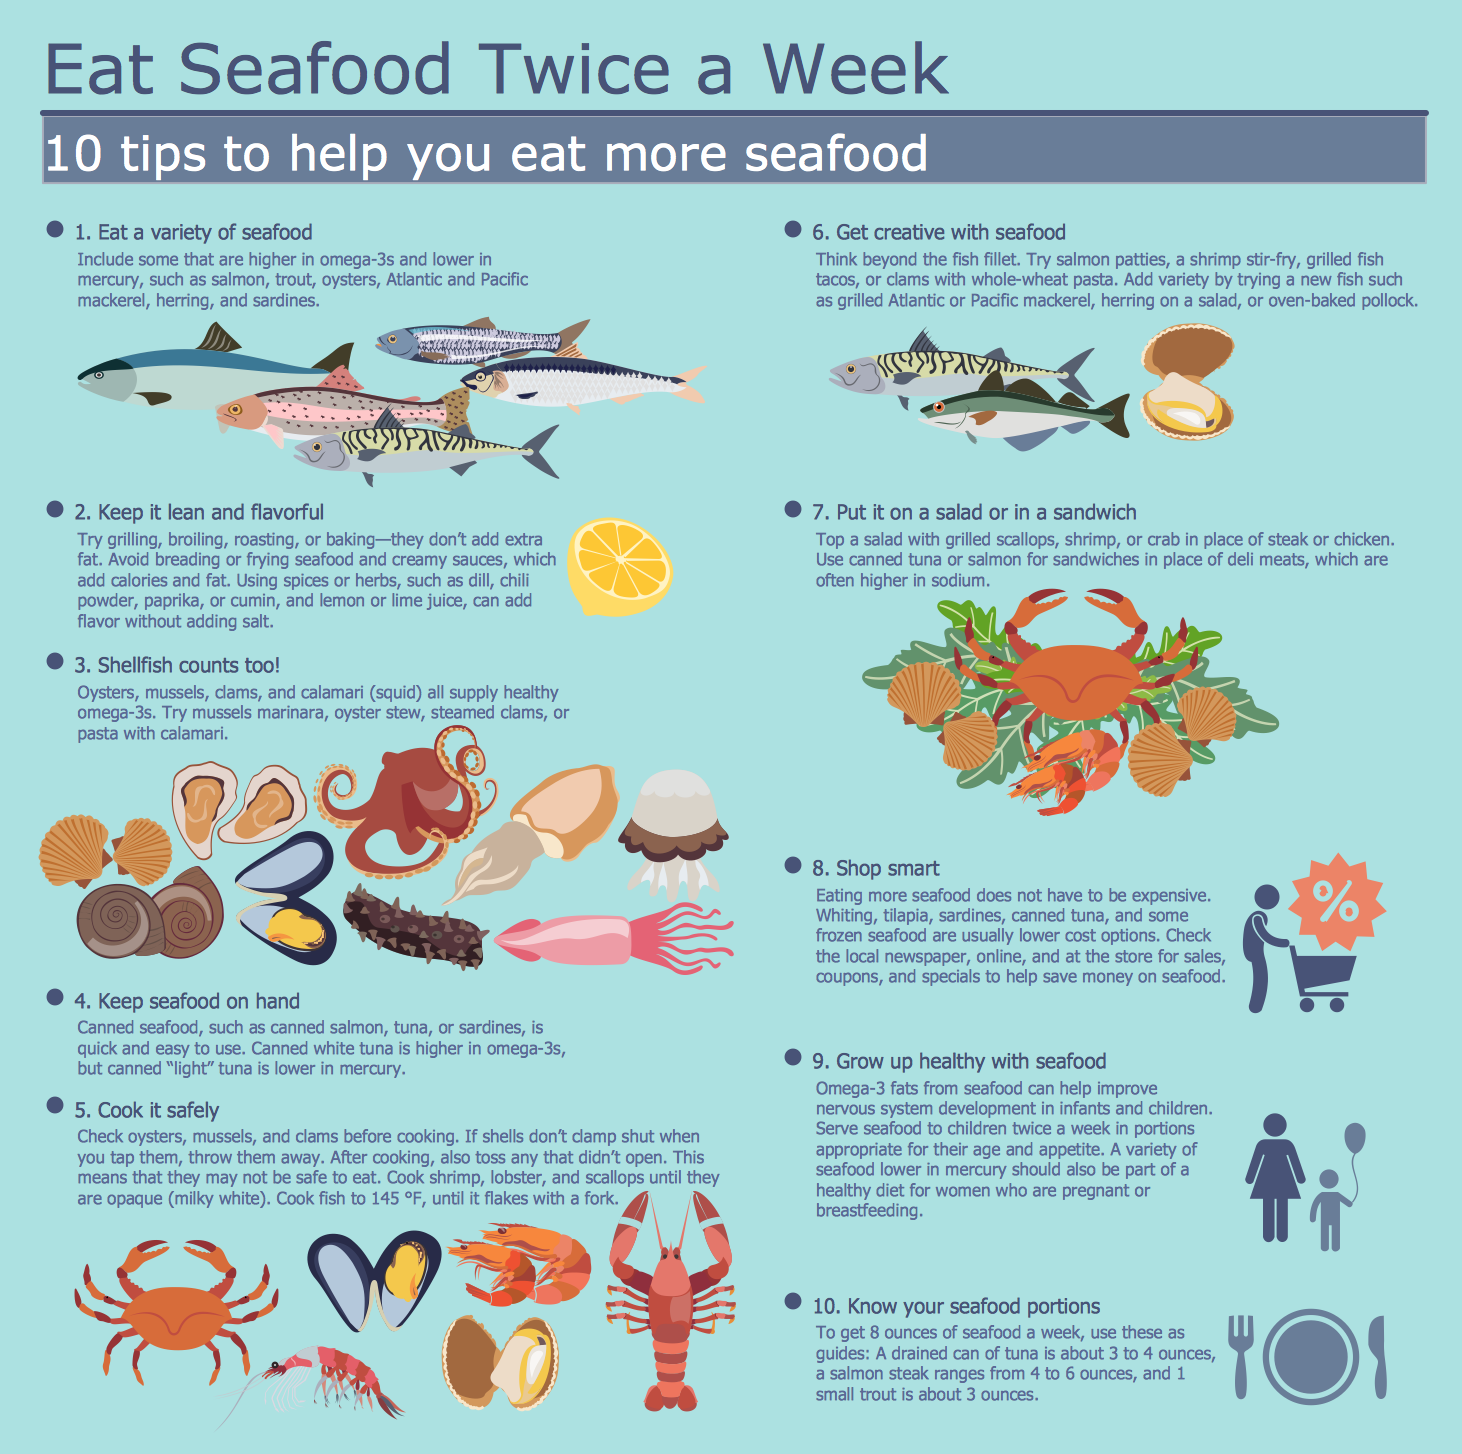
The most effective manner of presenting information on healthy diet and food nutrition is using various visualizations such as charts or infographics. To help easily create infographics and diagrams of healthy eating, ConceptDraw has provided the Health Food solution to its Solution Park. It contains vector stencil libraries of healthy eating options, samples of diagrams and infographics, and a set of templates to help you create your own diagrams, infographics and even adds. Using ConceptDraw PRO you can easily create and share healthy food recipes and materials about the proper nutrition.
 Health Food
The Health Food solution contains the set of professionally designed samples and large collection of vector graphic libraries of healthy foods symbols of fruits, vegetables, herbs, nuts, beans, seafood, meat, dairy foods, drinks, which give powerful possi
The vector stencils library "Medicine and health pictograms" contains 20 icons of medical and healthcare symbols.
Use it to draw your medical and healthcare infographics.
The example "Medicine and health pictograms - Vector stencils library" was created using the ConceptDraw PRO diagramming and vector drawing software extended with the Pictorial infographics solution from the area "What is infographics" in ConceptDraw Solution Park.
Healthy Food Recipes
A healthy lifestyle and a balanced healthy diet are the basis of health, longevity and good feeling. Every day a human must receive with a food the correct proportions of nutrients and vitamins. It is very important to make a proper menu that includes tasty and healthy dishes. ConceptDraw PRO diagramming and vector drawing software enhanced with Health Food solution from the Food and Beverage area of ConceptDraw Solution Park will help you easy develop, depict and appetizingly illustrate your healthy food recipes.Flowchart Examples and Templates
ConceptDraw PRO vector diagramming software and ConceptDraw Solution Park provide a wide variety of diagrams, organizational charts, business charts and flowchart examples, templates and samples. You are free to choose any example or template you are interested in from the ConceptDraw STORE, then use it to simplify your work at the designing professional-looking flowcharts and diagrams. As for flowcharts, turn your attention for the Flowcharts solution from the "Diagrams" area of ConceptDraw Solution Park, Process Flowcharts and Cross-Functional Flowcharts solutions from the Business Processes area, Accounting Flowcharts and Audit Flowcharts solutions from the Finance and Accounting area, which are completely devoted to flowcharts creation and provide an enormous collection of helpful flowchart templates and samples. Each of them is specially developed, well thought-out, dedicated to a certain thematic and carries a specific purpose. You need only to determine with your needs and to decide which one corresponds them the best and suits for you.Design Pictorial Infographics. Design Infographics
In the course of recent decades data visualization went through significant development and has become an indispensable tool of journalism, business intelligence and science. The way visual information may be conveyed is not limited simply to static or dynamic representation, it can also be interactive. Infographics can be conditionally divided into several general levels. Primarily, this is level of visualization of information, its interpretation and association on any ground. Second level can be defined as a visualization of knowledge, depiction of thoughts and ideas in the form of images or diagrams. Finally, the level of data visualization, which processes data arrays in charts, enabling the information to be more clearly perceived. You can also identify the main approaches to the creation of infographics: exploratory and narrative. Exploratory method insists on minimalist design in favor of data precision without unnecessary details and is common for scientific researches and anaHelpDesk
How to Draw a Circular Arrows Diagram Using ConceptDraw PRO
The cyclic recurrence is a fundamental property of multiple systems. The cycle is a process which consists from elements (phases, stages, stages) following each other. Many processes in astronomy, biology, chemistry, physics, mathematics, etc. have a cycle properties. It is also widely used in information technologies and marketing analysis. Graphical representation of cyclic processes can have many forms. It can be a circle, parabola, hyperbola, ellipse and others. A Circular Arrows Diagram is used as one of the statistical charts in the business, mass media and marketing. ConceptDraw PRO provides its users tools for making easy drawing Circular Arrows Diagrams.How to Draw Pictorial Chart. How to Use Infograms
How to draw pictorial chart quick, easy and effective? ConceptDraw PRO offers the unique Pictorial Infographics Solution that will help you! Pictorial Infographics solution contains large number of libraries with variety of predesigned vector pictograms that allows you design infographics in minutes. There are available 10 libraries with 197 vector pictograms.
 Bar Graphs
The Bar Graphs solution enhances ConceptDraw PRO v10 functionality with templates, numerous professional-looking samples, and a library of vector stencils for drawing different types of Bar Graphs, such as Simple Bar Graph, Double Bar Graph, Divided Bar Graph, Horizontal Bar Graph, Vertical Bar Graph, and Column Bar Chart.
Cross-Functional Flowchart
Use of Cross-Functional Flowchart is a clear way of showing each team member’s responsibilities and how processes get shared or transferred between different responsible people, teams and departments. Use the best flowchart maker ConceptDraw PRO with a range of standardized cross-functional flowchart symbols to create the Cross-Functional Flowcharts simply and to visualize the relationship between a business process and the functional units responsible for that process. To draw the most quickly Cross-Functional Flowcharts, Cross Functional Process Maps, or Cross Functional Process Flow Diagrams, start with a Cross-functional flowchart samples and templates from ConceptDraw Solution Park. The ConceptDraw Arrows10 and RapidDraw technologies will be also useful for you in drawing. ConceptDraw PRO supports designing both types - horizontal and vertical Cross-functional flowcharts. A vertical layout makes the accents mainly on the functional units while a horizontal layout - on the process. If you need a Visio alternative in Mac OS X, try ConceptDraw PRO. Its interface is very intuitive and it’s actually much easier to use than Visio, yet somehow it’s just as powerful if not more so. ConceptDraw PRO performs professional quality work and seamless Visio interaction.
Business Process Modeling Notation
ConceptDraw PRO is a software for simplу depicting the business processes based on BPMN 2.0. Business Process Diagrams Cross-Functional-Flowcharts, Workflows, Process Charts, IDEF0 and IDEF2, Timeline, Calendars, Gantt Charts, Business Process Modeling, Audit and Opportunity Flowcharts and Mind Maps (presentations, meeting agendas).UML Use Case Diagram Example Registration System
This sample was created in ConceptDraw PRO diagramming and vector drawing software using the UML Use Case Diagram library of the Rapid UML Solution from the Software Development area of ConceptDraw Solution Park. This sample shows the types of user’s interactions with the system and is used at the registration and working with the database system.
 Circle-Spoke Diagrams
Examples of subject areas that are well suited to this approach are marketing, business, products promotion, process modeling, market, resource, time, and cost analysis. Circle-Spoke Diagrams are successfully used in presentations, conferences, management documents, magazines, reportages, reviews, reports, TV, and social media.
- New Health Food Solution for ConceptDraw PRO
- Draw The Organisational Chart Of The Community Health Centre
- Social determinants of health | Process Flowchart | How to Draw an ...
- Pie Charts | ConceptDraw Solution Park | Health Food | Draw A Pie ...
- Health Diet Drawings Draw Images
- Health Food | How To Draw Nutrition Food On A Chart
- How to Draw an Organization Chart | 25 Typical Orgcharts | Orgchart ...
- Healthy Diet Plan | Healthy Meal Recipes | Healthy Foods | Drawing ...
- How To Draw A Bubble Diagram Of Primary Health Centre
- How to Draw an Organization Chart | 25 Typical Orgcharts | Orgchart ...
- Draw A Typical Diagram Of Ministry Of Health
- Draw An Organogram Of A Ministry Of Health
- Healthy Diet | Healthy Foods | Healthy Food Ideas | Draw Examples ...
- Health Food | Pie Chart And Bar Graph Of Nutrition Draw
- Image Of Balance Diet Chart For Drawing With Label
- Www Draw An Organizational Chart Of Health Sector
- Draw A Flowchart Of World Health Organization
- Healthy Food Recipes | Food Court | Health Food | Draw Balanced ...
- Healthy Food Recipes | Food Court | Health Food | Www Download ...
- Healthy Diet Plan | Food Court | Health Food | Draw And Labelled A ...
