HelpDesk
How to Create Infographics that Help People Eat Healthy
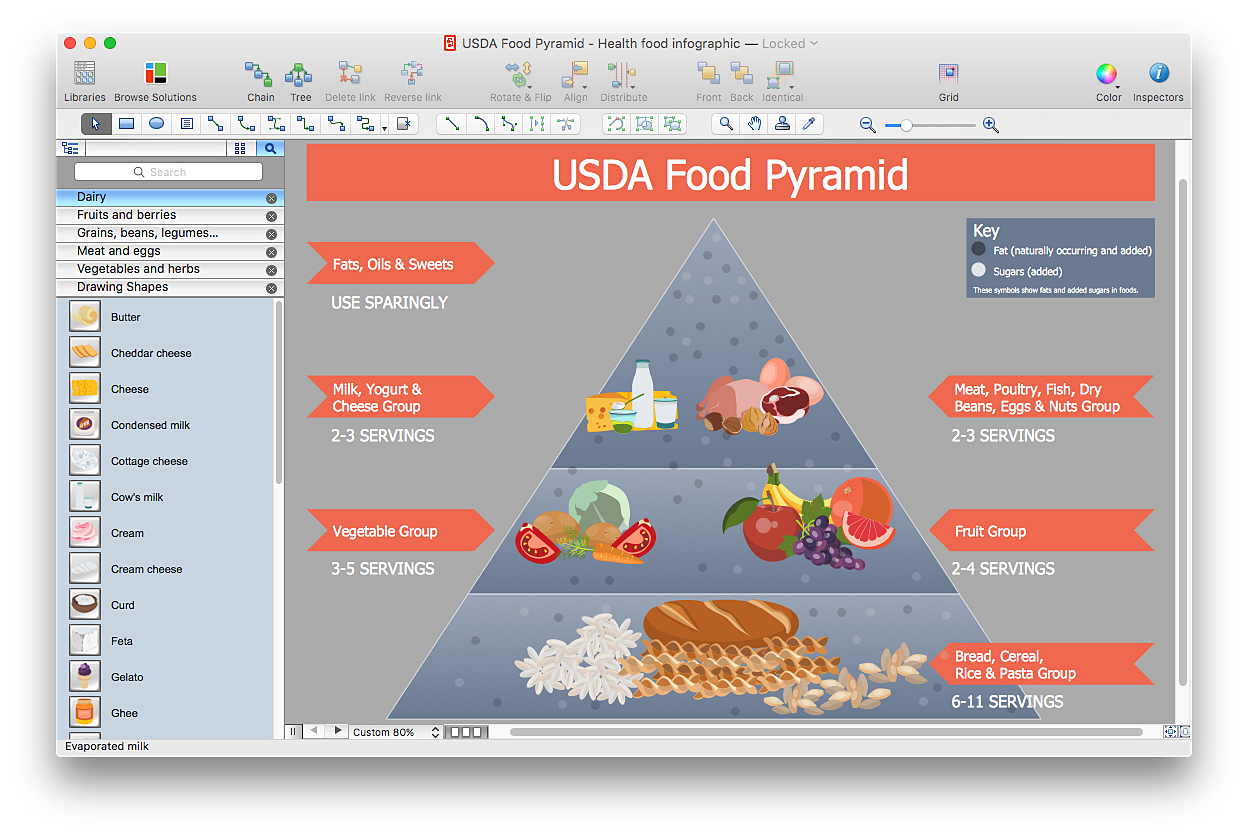
The most effective manner of presenting information on healthy diet and food nutrition is using various visualizations such as charts or infographics. To help easily create infographics and diagrams of healthy eating, ConceptDraw has provided the Health Food solution to its Solution Park. It contains vector stencil libraries of healthy eating options, samples of diagrams and infographics, and a set of templates to help you create your own diagrams, infographics and even adds. Using ConceptDraw PRO you can easily create and share healthy food recipes and materials about the proper nutrition.
 ConceptDraw Solution Park
ConceptDraw Solution Park collects graphic extensions, examples and learning materials
Healthy Foods
Use of various charts, diagrams and infographics is the most effective way of visual presenting information about healthy foods, healthy eating and healthy diet. ConceptDraw PRO diagramming and vector drawing software offers the Health Food solution from the Food and Beverage area of ConceptDraw Solution Park which is overfull of powerful drawing tools, libraries with ready-to-use vector objects and clipart, predesigned samples and examples which will help you easy design healthy foods illustrations.
 Health Food
The Health Food solution contains the set of professionally designed samples and large collection of vector graphic libraries of healthy foods symbols of fruits, vegetables, herbs, nuts, beans, seafood, meat, dairy foods, drinks, which give powerful possi
 Pyramid Diagrams
Pyramid Diagrams solution extends ConceptDraw PRO software with templates, samples and library of vector stencils for drawing the marketing pyramid diagrams.
 Seven Management and Planning Tools
Seven Management and Planning Tools solution extends ConceptDraw PRO and ConceptDraw MINDMAP with features, templates, samples and libraries of vector stencils for drawing management mind maps and diagrams.
 Seating Plans
The correct and convenient arrangement of tables, chairs and other furniture in auditoriums, theaters, cinemas, banquet halls, restaurants, and many other premises and buildings which accommodate large quantity of people, has great value and in many cases requires drawing detailed plans. The Seating Plans Solution is specially developed for their easy construction.
 Organizational Charts
Organizational Charts solution extends ConceptDraw PRO software with samples, templates and library of vector stencils for drawing the org charts.
 Area Charts
Area Charts are used to display the cumulative totals over time using numbers or percentages; or to show trends over time among related attributes. The Area Chart is effective when comparing two or more quantities. Each series of data is typically represented with a different color, the use of color transparency in an object’s transparency shows overlapped areas and smaller areas hidden behind larger areas.
 Pie Charts
Pie Charts are extensively used in statistics and business for explaining data and work results, in mass media for comparison (i.e. to visualize the percentage for the parts of one total), and in many other fields. The Pie Charts solution for ConceptDraw PRO v10 offers powerful drawing tools, varied templates, samples, and a library of vector stencils for simple construction and design of Pie Charts, Donut Chart, and Pie Graph Worksheets.
 25 Typical Orgcharts
The 25 Typical Orgcharts solution contains powerful organizational structure and organizational management drawing tools, a variety of professionally designed organization chart and matrix organization structure samples, 25 templates based on various orga
 Marketing Area
The solutions from Marketing area of ConceptDraw Solution Park collect templates, samples and libraries of vector stencils for drawing the marketing diagrams and mind maps.
 Bar Graphs
The Bar Graphs solution enhances ConceptDraw PRO v10 functionality with templates, numerous professional-looking samples, and a library of vector stencils for drawing different types of Bar Graphs, such as Simple Bar Graph, Double Bar Graph, Divided Bar Graph, Horizontal Bar Graph, Vertical Bar Graph, and Column Bar Chart.
- Pyramid Chart Examples | Medicine and health pictograms - Vector ...
- Pyramid Diagram | Pyramid Charts | Pyramid Diagram | Pyramid ...
- Pyramid Charts | Pyramid Diagram | Pyramid Diagram | Pyramid Image
- Pyramid Diagrams | ConceptDraw Solution Park | Health Food ...
- Pyramid Diagrams | ConceptDraw Solution Park | Illustration Health ...
- Health Chart For Drawing
- Pyramid Diagrams | Illustrate Health Information System By Using ...
- Quality function deployment chart - Handheld projector | Quality ...
- Great Pyramid Diagram
- Pyramid Diagram With Measurement
- Pyramid Diagrams | 25 Typical Orgcharts | Active Directory ...
- Health Food | Nutrition Related Flowchart Examples
- Fishbone Diagram | Fishbone Diagrams | Health Food | Fishbone ...
- How to Draw a Pyramid Diagram in ConceptDraw PRO | How to ...
- Design elements - Medicine and health pictograms | Medicine and ...
- UML Use Case Diagram Example Social Networking Sites Project ...
- Bar Diagrams for Problem Solving. Create space science bar charts ...
- | | | Health Stencil
- Health Food | Basic All Over Nutrition Represented By A Flow Chart

