HelpDesk
How to Create a Cross - Functional Flowchart Using ConceptDraw PRO
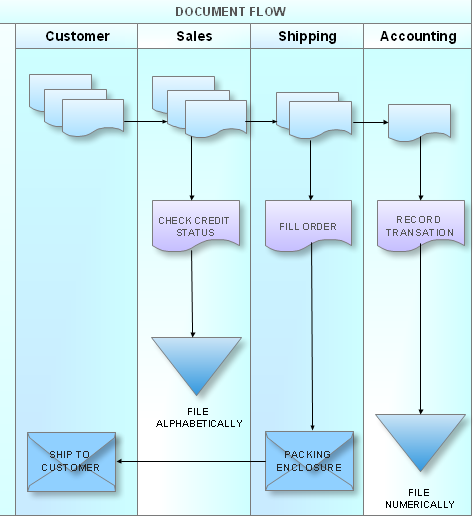
Cross-functional flowcharts are used to visualize cross-functional processes. Cross-functional process is a process that involves multiple divisions, each of which makes its part of the entire company workflow. For example: product development, lead management , client orders processing – and other critical processes. All of them are important both for business and customers, but the workflow and responsibilities distribution within these processes are divided between multiple departments and services. Cross-functional processes cannot be depicted with simple workflow diagrams, because of the specific interactions between company departments. ConceptDraw PRO has released the specialized solution to create cross-functional diagrams. Cross Functional Flowcharts solution includes a special set of templates and libraries to depict the cross-functional processes.
HelpDesk
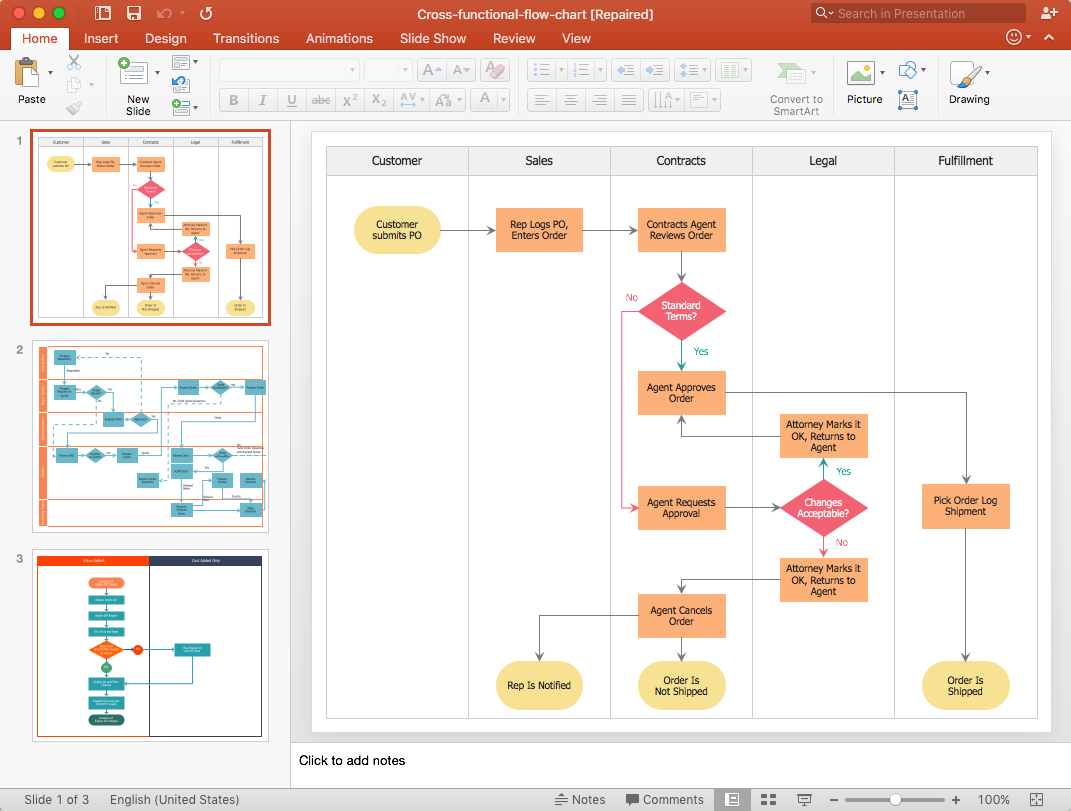
How to Add a Cross-Functional Flowchart to a PowerPoint Presentation
Using a Cross-Functional flowchart is a clear way of showing how business processes get shared or transferred between different teams and departments. ConceptDraw PRO allows you to make an MS PowerPoint Presentation from your flowcharts in a few simple steps.HelpDesk
How to Create a Release Burn-Down Chart Using ConceptDraw PRO
The Agile methodology provides project teams the ability to quickly adapt the project to the current situation and thus achieve maximum productivity. According the Scrum method the steps needed to fulfill the project goal breaks down by using short sprints or iterations. The iterations together with an extensive collaboration can increase productivity by better understanding the entire flow of a project. A release burn-down chart is used to track a progress on a Scrum project. The ConceptDraw Scrum Workflow Solution makes it easy for Agile project team to build any professional Scrum diagram such as a Release velocity chart, Release burn-down chart, Sprint burn-down chart, or a Team velocity chart.Process Flowchart
The main reason of using Process Flowchart or PFD is to show relations between major parts of the system. Process Flowcharts are used in process engineering and chemical industry where there is a requirement of depicting relationships between major components only and not include minor parts. Process Flowcharts for single unit or multiple units differ in their structure and implementation. ConceptDraw PRO is Professional business process mapping software for making Process flowcharts, Process flow diagram, Workflow diagram, flowcharts and technical illustrations for business documents and also comprehensive visio for mac application. Easier define and document basic work and data flows, financial, production and quality management processes to increase efficiency of your business with ConcepDraw PRO. Business process mapping software with Flowchart Maker ConceptDraw PRO includes extensive drawing tools, rich examples and templates, process flowchart symbols and shape libraries, smart connectors that allow you create the flowcharts of complex processes, process flow diagrams, procedures and information exchange. Process Flowchart Solution is project management workflow tools which is part ConceptDraw Project marketing project management software. Drawing charts, diagrams, and network layouts has long been the monopoly of Microsoft Visio, making Mac users to struggle when needing such visio alternative like visio for mac, it requires only to view features, make a minor edit to, or print a diagram or chart. Thankfully to MS Visio alternative like ConceptDraw PRO software, this is cross-platform charting and business process management tool, now visio alternative for making sort of visio diagram is not a problem anymore however many people still name it business process visio tools.
Cross-Functional Flowchart
Use of Cross-Functional Flowchart is a clear way of showing each team member’s responsibilities and how processes get shared or transferred between different responsible people, teams and departments. Use the best flowchart maker ConceptDraw PRO with a range of standardized cross-functional flowchart symbols to create the Cross-Functional Flowcharts simply and to visualize the relationship between a business process and the functional units responsible for that process. To draw the most quickly Cross-Functional Flowcharts, Cross Functional Process Maps, or Cross Functional Process Flow Diagrams, start with a Cross-functional flowchart samples and templates from ConceptDraw Solution Park. The ConceptDraw Arrows10 and RapidDraw technologies will be also useful for you in drawing. ConceptDraw PRO supports designing both types - horizontal and vertical Cross-functional flowcharts. A vertical layout makes the accents mainly on the functional units while a horizontal layout - on the process. If you need a Visio alternative in Mac OS X, try ConceptDraw PRO. Its interface is very intuitive and it’s actually much easier to use than Visio, yet somehow it’s just as powerful if not more so. ConceptDraw PRO performs professional quality work and seamless Visio interaction.
HelpDesk
How to Create a SIPOC Diagram
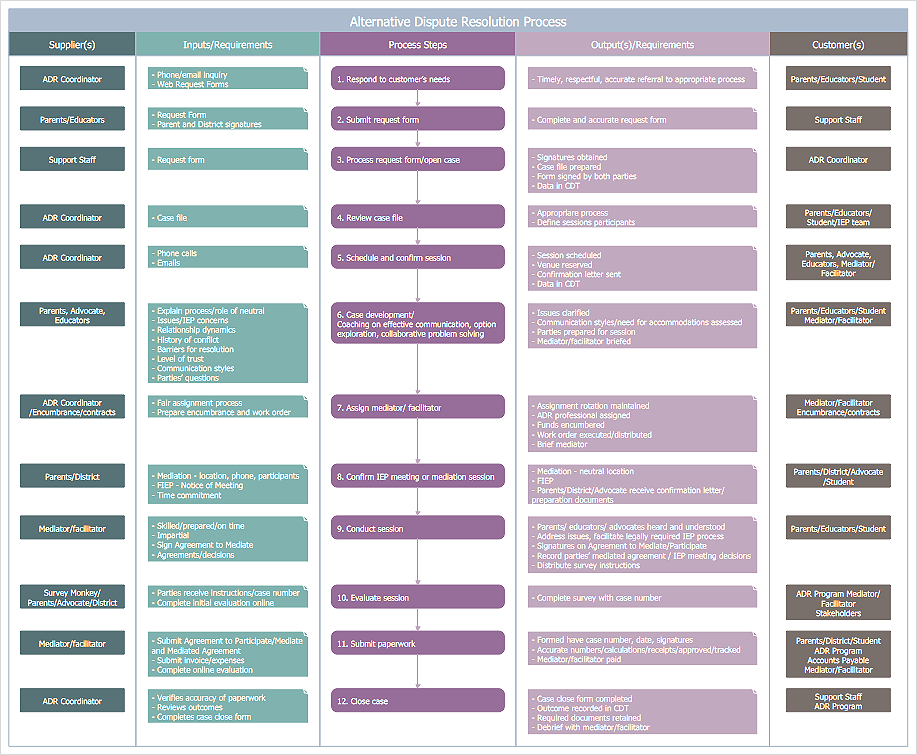
SIPOC (suppliers, inputs, process, outputs, customers) diagram is focused on the quality of a business process inputs and outputs. SIPOC diagram has a form of a segmented table that gives comprehensive outline for each category. SIPOC diagram depicts the start and end of a process, and the relationships between a company and its suppliers. SIPOC diagram is an important part of the Six Sigma methodology. With its Business Process Mapping solution, ConceptDraw PRO offers a power set of process mapping tools to empower quality management within an organization.HelpDesk
How to Draw a Gantt Chart Using ConceptDraw PRO
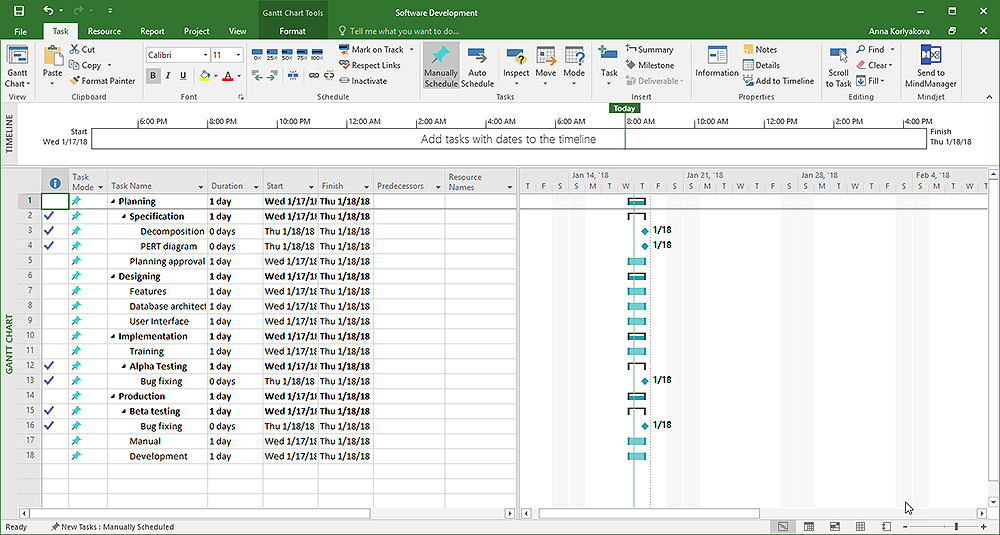
A Gantt chart is intended to provide a visualization of a project schedule. It is developed to help planning, coordinating, and tracking on project tasks implementation. One of the most critical resources for a project implementation is a time resources. Gantt chart - is one of the most convenient and popular way of graphical representation of a project tasks progress in conjunction with the corresponding time consumption. Gantt chart's function is to show project tasks completion in a progress, and to make a project manager sure that project tasks were completed on time. ConceptDraw Office is a clear and easy-to-use tool for project management. It is a very handy visual tool that helps make a project processing clear.HelpDesk
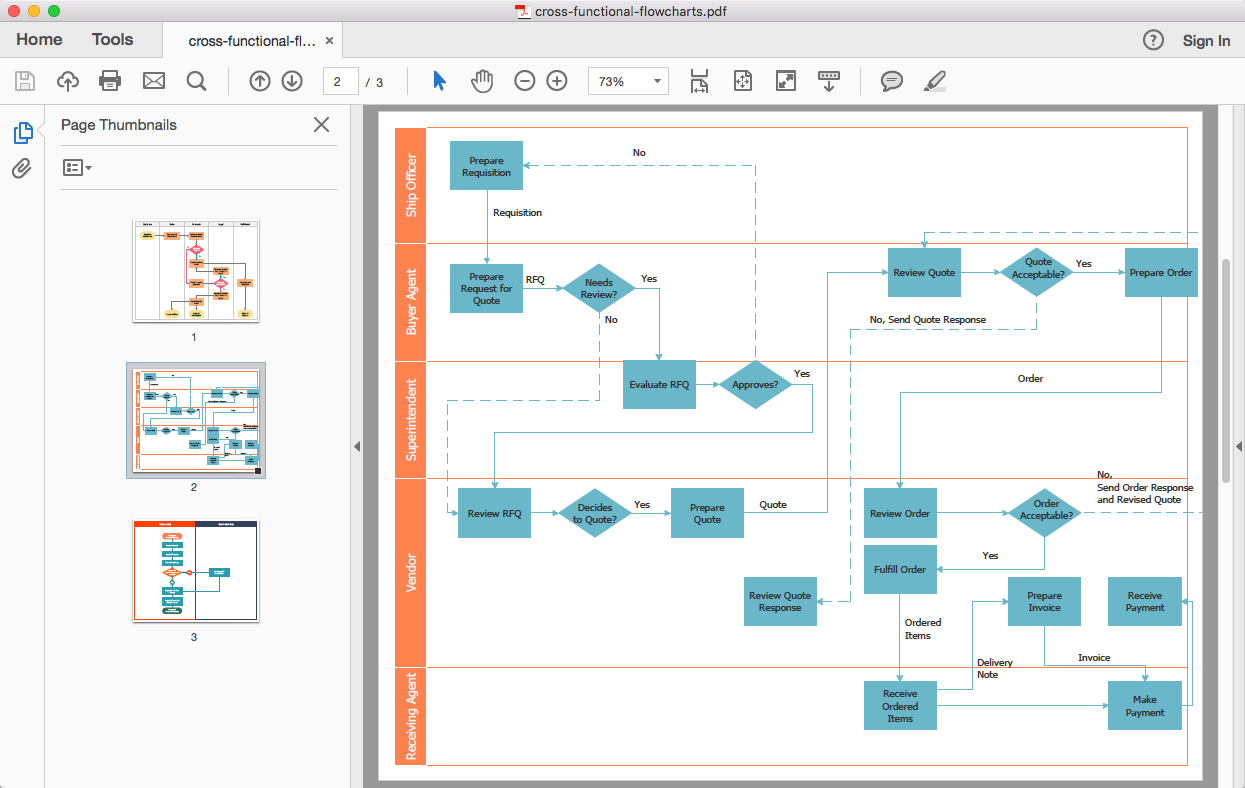
How to Add a Cross-Functional Flowchart to Adobe PDF
ConceptDraw PRO allows you to easy share your business process documentation between different computers with different operating systems and applications using it's export capabilities. You can get your cross-functional flowcharts in pdf format and avoid any problems while communicating them.HelpDesk
How to Generate ConceptDraw PROJECT Standard Reports on Mac
Project reporting is one of the key functions of effective project management. Using regular project reports, project manager can constantly track and analyze the project’s execution. This analytic process can help to ensure that the team reaches the best possible solutions. ConceptDraw PROJECT is a professional software tool for project management with the advanced mechanism of reporting. You can create the set of regular reports on project activities, task statuses, cash flow and assignments in MS Excel format. Mind map reports are also available.HelpDesk
How to Convert a Mind Map into MS Project XML
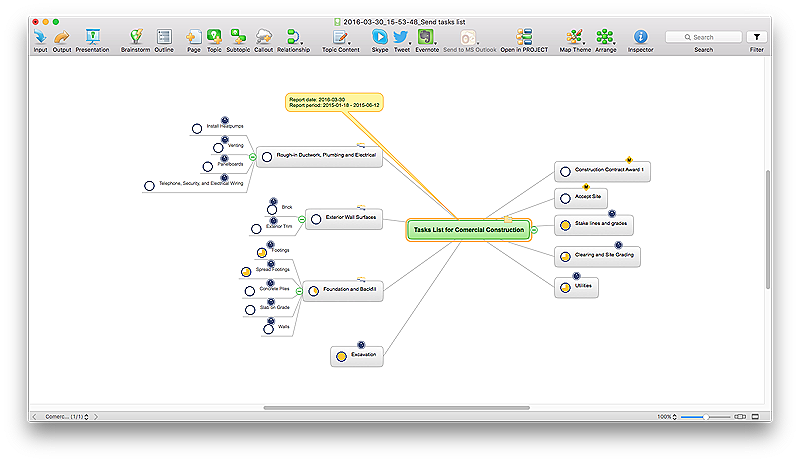
The easiest way to start this project is to conduct a brainstorm session that identifies necessary tasks, then prepare a project schedule in the form of a Gantt chart and assign resources to tasks. With ConceptDraw MINDMAP, you can initiate a project using mind map to represent all critical and important tasks. ConceptDraw MINDMAP supports a mind map export to MS Project; it also allows import a project file from MS Project giving team members who use OS X or Windows a working visual map of a planned project.HelpDesk
How to Draw a Matrix Organizational Chart with ConceptDraw PRO
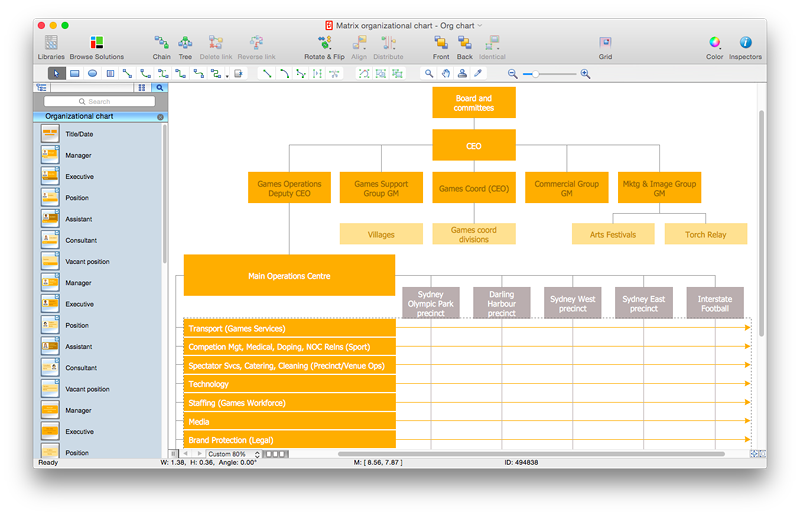
There are a number of moments which are influenced on how the organizational structure of a certain business needs to be, how complex, and which type it should keep. The matrix organizational structure is atypical because it brings together employees and managers from different departments to work toward accomplishing a goal. This structure is commonly found in businesses that have more than one line of reportage. For instance, a company might contain an engineering department with engineering managers who workers report to. However, these workers might also have to liaise with different product or project managers depending on current tasks. Some form of matrix organization is found in most large-scale modern businesses. It is one of the most complicated reporting structures. You can easily build a clear matrix organizational chart in ConceptDraw PRO using templates from ConceptDraw Solution Park.HelpDesk
How to Manage Problem Solving Using Seven Management and Planning Tools
Stage by stage gouide on using visual tools to move toward solving the problem.
Sales Process Flowchart Symbols
The most easier way of creating the visually engaging and informative Sales Process Flowchart is to create the new ConceptDraw document and to use the predesigned vector symbols offered in 6 libraries of the Sales Flowchart Solution. There are more than six types of sales process flow diagrams, ConceptDraw PRO software is flowchart maker which include six collections of extended flowchart symbols for effective diagramming. There are main collections of color coded flowchart symbols: Sales Department, Sales Steps, Sales Workflow, Sales Symbols and special set of Sales Arrows and Sales Flowchart.HelpDesk
Agile Mind Maps: Exploring the User Wishes
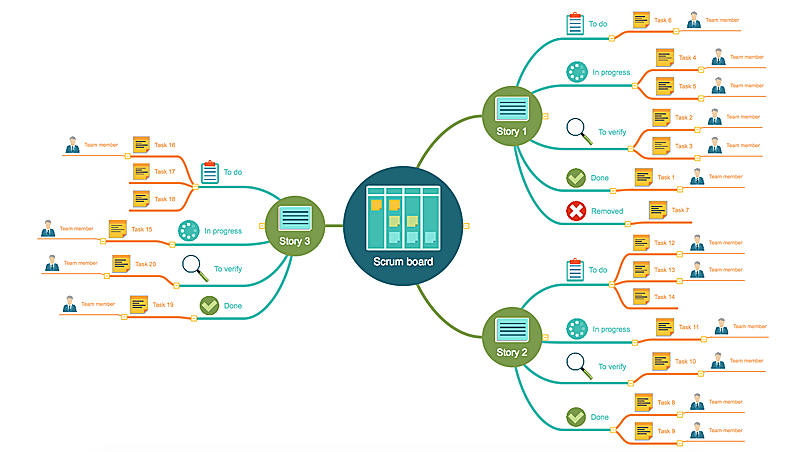
Agile method advocate use cases and user stories, but there are no standard processes or guides available to help gather user requirements. That is why documenting user requirements can be challenging. Without strong communication experience the scrum process can collapse, leading towards unfruitful requirements and imperfect software. This article offers a path to overcome these hurdles through the simplicity and clearness of mind mapping. ConceptDraw Scrum Worflow solution lets explore the user requirements for your Agile development project before they are formalized. You can easily create professional Mind Maps that will effectively collect and structure the information on what a user actually wants, or the “User Wish.”- Types of Flowchart - Overview | Process Flowchart | Basic Flowchart ...
- Cross-Functional Flowchart | Cross-Functional Flowcharts
- Process Flowchart | How To Convert a Flowchart to Adobe PDF ...
- Process Flowchart | How to Add a Workflow Diagram to a ...
- Cross-Functional Flowchart | How to Create a Cross - Functional ...
- Job Description Flow Chart
- Work Order Process Flowchart . Business Process Mapping ...
- Cross Functional Flowchart Visio Examples
- Sales Process Flowchart . Flowchart Examples | Sales Process ...
- Basic Flowchart Symbols and Meaning | Cross Functional Flowchart ...
- Process Flowchart | Basic Flowchart Symbols and Meaning ...
- Flowchart Help Desk It
- Cross-Functional Flowchart (Swim Lanes) | Cross-Functional ...
- Cross-Functional Flowchart | Basic Flowchart Symbols and Meaning ...
- Cross-Functional Flowchart (Swim Lanes) | Swim Lane Diagrams ...
- Process Flowchart | How To Use Collaboration Tool in Project ...
- How to Create a HR Process Flowchart Using ConceptDraw PRO ...
- Swim Lane Diagrams | Swim Lanes Flowchart . Flowchart Examples ...
- Process Flowchart | Cross-functional flowchart Templates portrait ...
- Basic Flowchart Symbols and Meaning | Cross-Functional Flowchart ...
