Context Diagram Template
This template shows the Context Diagram. It was created in ConceptDraw DIAGRAM diagramming and vector drawing software using the Block Diagrams Solution from the “Diagrams” area of ConceptDraw Solution Park.
The context diagram graphically identifies the system. external factors, and relations between them. It’s a high level view of the system. The context diagrams are widely used in software engineering and systems engineering for designing the systems that process the information.
Fault Tree Analysis Diagrams
This solution extends ConceptDraw DIAGRAM.5 or later with templates, fault tree analysis example, samples and a library of vector design elements for drawing FTA diagrams (or negative analytical trees), cause and effect diagrams and fault tree diagrams.
Flowchart Definition
Flowchart definition - A Flowchart is a graphically representation of the structure of process or system, algorithm or the step-by-step solution of the problem. The Flowchart describes the flow of data through an information processing systems and the parts of the flows. The flow is a set of the logic operations that meet the certain requirements.Cause and Effect Analysis
Cause and Effect Analysis - The Seven Management and Planning Tools is a tool for Cause and Effect Analysis that allows users to analyze the root causes for factors that influenced the problem. This diagram is constructed separately for each highly prioritized factor. The Diagram is then used for further formulation of potential actions.Process Flow Chart
A Process Flow Chart is a type of flowchart which is mostly used in industrial, chemical and process engineering for illustrating high-level processes, major plant processes and not shows minor details.ConceptDraw DIAGRAM diagramming and vector drawing software extended with Flowcharts Solution from the "Diagrams" Area of ConceptDraw Solution Park is the best way to create Process Flow Chart and other types of flowcharts.
HelpDesk
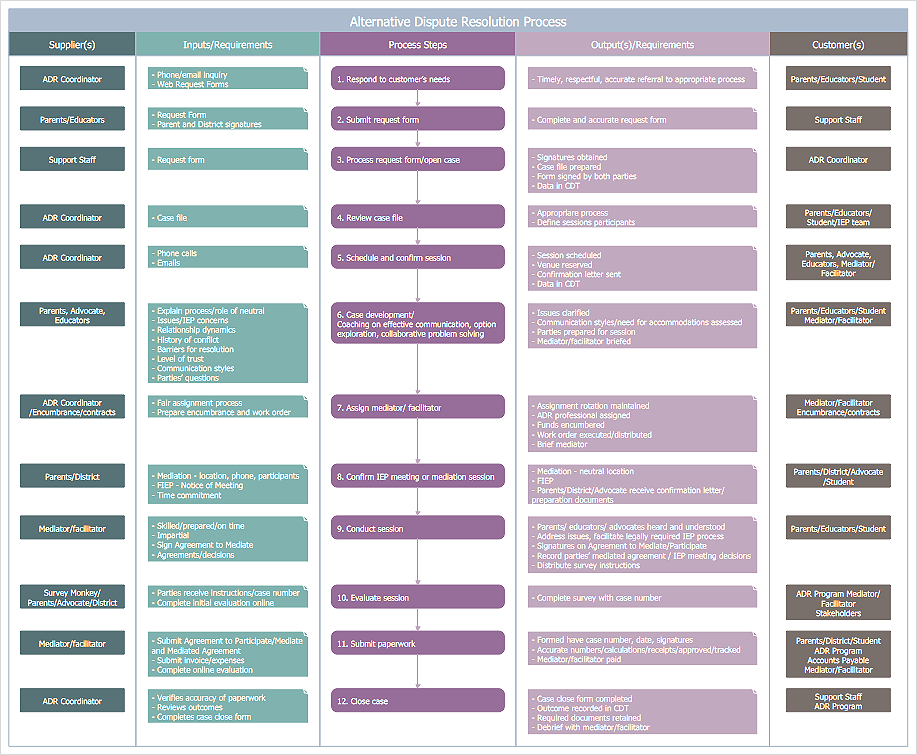
How to Create a SIPOC Diagram
SIPOC (suppliers, inputs, process, outputs, customers) diagram is focused on the quality of a business process inputs and outputs. SIPOC diagram has a form of a segmented table that gives a comprehensive outline for each category. SIPOC diagram depicts the start and end of a process and the relationships between a company and its suppliers. SIPOC diagram is an important part of the Six Sigma methodology. With its Business Process Mapping solution, ConceptDraw DIAGRAM offers a powerful set of process mapping tools to empower quality management within an organization.Data Flow Diagram
Data flow diagram (DFD) is the part of the SSADM method (Structured Systems Analysis and Design Methodology), intended for analysis and information systems projection. Data flow diagrams are intended for graphical representation of data flows in the information system and for analysis of data processing during the structural projection. Data flow diagram often used in connection with human process and can be displayed as workflow diagram. The critical Process Flow Diagram is another flowchart technique for designing data flow in connection with organizational processes. The critical Process flow diagram may use different range of symbols than a classic workflow diagram.SWOT Matrix Template
A SWOT analysis can be carried out for a product, place, industry or person. It involves specifying the objective of the business venture or project and identifying the internal and external factors that are favorable and unfavorable to achieving that objective.Pyramid Diagram
Pyramid chart example is included in the Pyramid Diagrams solution from Marketing area of ConceptDraw Solution Park.Data Flow Diagram Examples
You need to draw the Data Flow Diagram? Use ConceptDraw DIAGRAM diagramming and vector drawing software extended with Data Flow Diagrams solution from the Software Development area of ConceptDraw Solution Park.The Data Flow Diagrams solution provides a numerous collection of Data Flow Diagram examples created according to Gane and Sarson, and Yourdon and Coad notations using the ConceptDraw DIAGRAM software.- High Level Analysis Template
- High level fault tree | SWOT and TOWS Matrix Diagrams | Data ...
- Fault Tree Analysis Diagrams | High Level Tree Diagram Excel
- Context Diagram Template | DFD Library System | Example of DFD ...
- Root cause analysis tree diagram - Template | Fault Tree Diagram ...
- High Level Solution Architecture Of Online Library Management
- Fault Tree Analysis Diagrams | How To Create Root Cause Analysis ...
- PROBLEM ANALYSIS . Root Cause Analysis Tree Diagram | Root ...
- High level fault tree | Design Element: Rack Diagram for Network ...
- SWOT matrix template | SWOT Analysis | SWOT Sample in ...
- ERD | Entity Relationship Diagrams, ERD Software for Mac and Win
- Flowchart | Basic Flowchart Symbols and Meaning
- Flowchart | Flowchart Design - Symbols, Shapes, Stencils and Icons
- Flowchart | Flow Chart Symbols
- Electrical | Electrical Drawing - Wiring and Circuits Schematics
- Flowchart | Common Flowchart Symbols