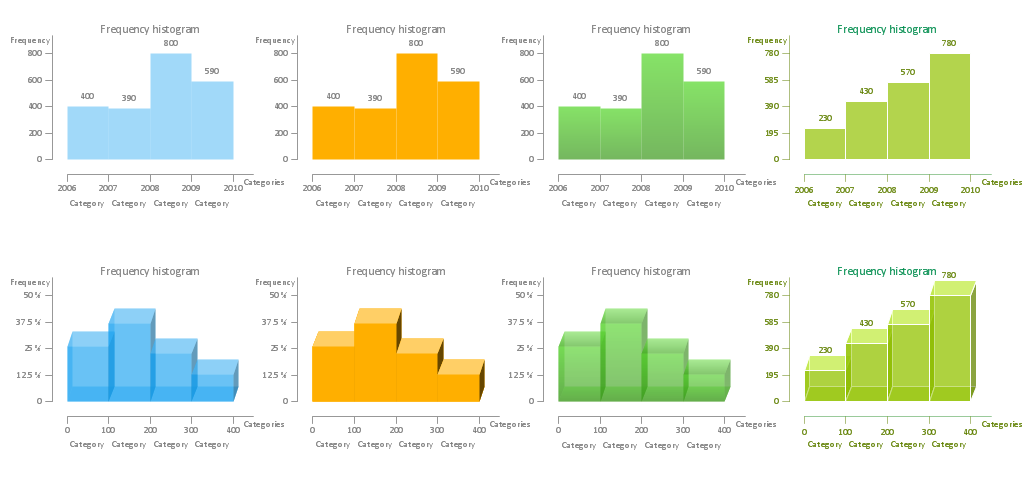
 Histograms
How to make a Histogram? Making a Histogram is an incredibly easy process when it is done with ConceptDraw DIAGRAM. The Histograms Solution enhances ConceptDraw DIAGRAM functionality with extensive drawing tools, numerous samples, and examples; also a quick-start template and library of ready vector stencils for visualization the data and professional drawing Histograms.
HelpDesk
How to Draw a Histogram
A histogram is a diagram used to visualize data through bars of variable heights. Making histogram can be helpful if you need to show data covering various periods (hours, days, weeks, etc). When the vertical column of the histogram refers to the frequency it shows how many times an event happens. It is a Frequency Histogram. A bar chart diagram is similar to a histogram, but in contrast to a bar chart, a histogram represents the number how many times there have been certain data values. You can use a histogram to depict continual data flow such as temperature, time, etc. You can effortlessly draw histograms using the Histograms solution for ConceptDraw DIAGRAM. Making a histogram can be very useful to represent various statistical data.How To Make a Histogram?
How to make a Histogram quick and easy? ConceptDraw DIAGRAM diagramming and vector drawing software extended with Histograms solution from the Graphs and Charts area will effectively help you in Histogram drawing.Chart Examples
Easy charting software comes with beautiful chart templates and examples. This makes it easy to create professional charts without prior experience.Scatter Chart Examples
The Line Graphs solution from Graphs and Charts area of ConceptDraw Solution Park contains a set of examples, templates and design elements library of scatter charts. Use it to draw scatter graphs using ConceptDraw DIAGRAM diagramming and vector drawing software for illustrating your documents, presentations and websites.Line Chart Examples
The Line Graphs solution from Graphs and Charts area of ConceptDraw Solution Park contains a set of examples, templates and design elements library of line and scatter charts. Use it to draw line and scatter graphs using ConceptDraw DIAGRAM diagramming and vector drawing software for illustrating your documents, presentations and websites.
 Value Stream Mapping
Value stream mapping solution extends ConceptDraw DIAGRAM software with templates, samples and vector stencils for drawing the Value Stream Maps (VSM) in lean manufacturing practice.
How to Create a Scatter Chart
Simple tutorial help you learn how to draw a scatter chart and increase you possibilities of understanding and work more effective with our scatter chart software.Pyramid Diagram and Pyramid Chart
Pyramid Diagram, Triangle Chart or Triangular Diagram is a convenient and useful type of diagrams, which lets represent the data hierarchical structure and to illustrate the foundation-based relationships between the hierarchy levels. Pyramid Diagrams are used to visualize effectively the hierarchical, as well as proportional and foundation-based relationships, the process steps, the interconnections of organizational layers or topics. ConceptDraw DIAGRAM software enhanced with Pyramid Diagrams solution from Marketing area of ConceptDraw Solution Park is a powerful business charting software, that includes all required tools for designing the multilevel Pyramid Diagrams as quickly as possible. The build-in vector stencils and templates are the great aid for designers, a variety of examples and samples is a good base and source of inspiration. Use attractive and vivid 2D and 3D Pyramid Diagrams and Triangle Charts designed in ConceptDraw DIAGRAM to illustrate your documents, presentations, infographics, articles, reports, websites, etc.Pie Chart Word Template. Pie Chart Examples
The Pie Chart visualizes the data as the proportional parts of a whole and looks like a disk divided into sectors. The pie chart is type of graph, pie chart looks as circle devided into sectors. Pie Charts are widely used in the business, statistics, analytics, mass media. It’s very effective way of displaying relative sizes of parts, the proportion of the whole thing.Make a Histogram
ConceptDraw DIAGRAM extended with Histograms solution from the Graphs and Charts area of ConceptDraw Solution Park lets you make a Histogram of any complexity in minutes.
 Seven Basic Tools of Quality
Manage quality control in the workplace, using fishbone diagrams, flowcharts, Pareto charts and histograms, provided by the Seven Basic Tools of Quality solution.
Column Chart Examples
Column chart examples from ConceptDraw collection can help you find the best visual depiction for you data. You can easily modify column chart examples according to data you want to visualize.
 ConceptDraw Solution Park
ConceptDraw Solution Park collects graphic extensions, examples and learning materials
- Pyramid Diagram | Chart Examples | Fundraising Pyramid ...
- Competitor Analysis | Process Flowchart | Pyramid Chart Examples ...
- Normal distribution | Normal distribution graph - Template | How To ...
- Histogram Chart | Make a Histogram | Histogram | Histogram Visio
- Pie Chart Word Template. Pie Chart Examples | Pyramid Chart ...
- How to Draw a Histogram in ConceptDraw PRO | Histogram ...
- Histogram Chart | Make a Histogram | Histograms | What Is A ...
- Venn Diagram Examples for Problem Solving. Environmental Social ...
- Employee distribution - HR dashboard | Projects HR dashboard ...
- Business Report Pie. Pie Chart Examples | Design elements - Sales ...
- Chart Of Natural Tesource With Example
- Venn Diagrams | Venn Diagram | Venn Diagram Examples for ...
- Quality Control Chart Software — ISO Flowcharting | Total Quality ...
- Histograms Bar Graphs Software For Windows
- Gane Sarson Diagram | Universal Diagramming Area | Data ...
- Pyramid Diagram and Pyramid Chart | Pyramid Chart Examples ...
- Venn Diagram Examples for Problem Solving. Environmental Social ...
- SWOT Matrix Template | Basic Workflow Examples | Floor Plans ...
- Flow Chart Natural Resources With Example
- Picture Graphs | Bar Diagram Math | Chart Examples | Examples Of ...


