 Histograms
How to make a Histogram? Making a Histogram is an incredibly easy process when it is done with ConceptDraw DIAGRAM. The Histograms Solution enhances ConceptDraw DIAGRAM functionality with extensive drawing tools, numerous samples, and examples; also a quick-start template and library of ready vector stencils for visualization the data and professional drawing Histograms.
 Basic Histograms
This solution extends the capabilities of ConceptDraw DIAGRAM (or later) with templates, samples and a library of vector stencils for drawing Histograms.
Seven Basic Tools of Quality - Histogram

Chart Examples

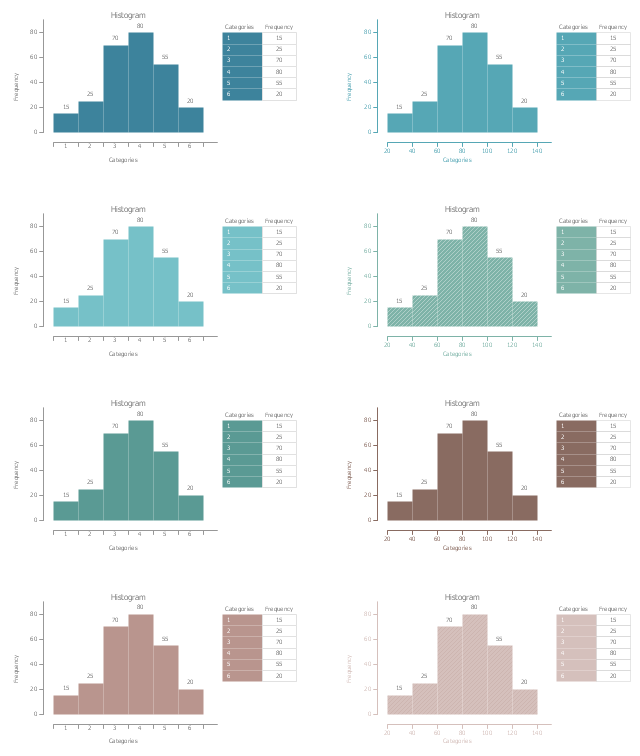
The vector stencils library "Histogram" contains 8 templates of histogram.
Use it to design your histograms with ConceptDraw PRO diagramming and vector drawing software.
"A histogram is a graphical representation of the distribution of numerical data. It is an estimate of the probability distribution of a continuous variable (quantitative variable) and was first introduced by Karl Pearson. ...
The histogram is one of the seven basic tools of quality control." [Histogram. Wikipedia]
The example of diagram templates "Design elements - Histogram" is included in the Seven Basic Tools of Quality solution from the Quality area of ConceptDraw Solution Park.
Histogram templates
 Artwork
Artwork solution extends ConceptDraw DIAGRAM software with illustration samples, templates and libraries of vector clipart of architecture, food, music, funny animals, aquatic fauna and transport.
 GHS Hazard Pictograms
GHS Hazard Pictograms solution contains the set of predesigned standard GHS pictograms, Hazardous symbols, and Hazard communication pictograms, approved and agreed by UN in Globally Harmonized System of Classification and Labelling of Chemicals (GHS). They can be used for quick and simple designing accurate and professional-looking infographics, diagrams, warning announcements, signboards, posters, precautionary declarations, regulatory documents, and for representing the main items of OSHA HAZCOM Standard.
Competitor Analysis

Bar Graph

 Aerospace and Transport
This solution extends ConceptDraw DIAGRAM software with templates, samples and library of vector clipart for drawing the Aerospace and Transport Illustrations. It contains clipart of aerospace objects and transportation vehicles, office buildings and anci
- Histograms | Basic Histograms | Chart Examples | Illustration Of ...
- Wind speed histogram | Resources and energy - Vector stencils ...
- Draw A Pie Chart And And Histogram For Healthy Food
- Histogram For Sources Of Energy
- Flowchart For Drawing Histograms
- Seven Basic Tools of Quality - Histogram | Histograms | Basic ...
- Histograms - Vector stencils library | Frequency distribution charts ...
- Block Diagrams | Histograms | Directional Maps | Restaurant Table ...
- Beetles in the river Thames | Geography - Vector stencils library ...