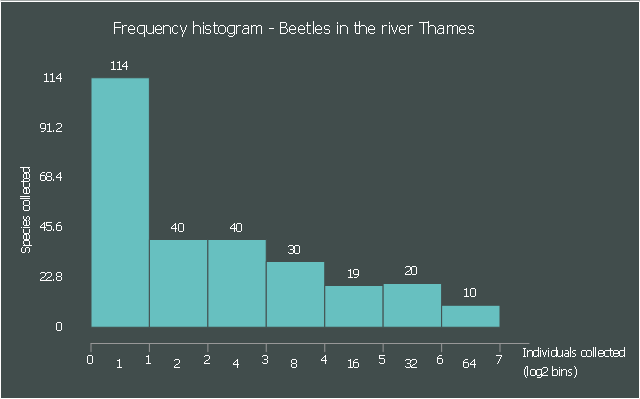
This frequency histogram sample shows the relative species abundance of beetles sampled from the river Thames. It was designed on the base of the Wikimedia Commons file: PrestonPlot beetles.png.
[commons.wikimedia.org/ wiki/ File:PrestonPlot_ beetles.png]
"Relative species abundance is a component of biodiversity and refers to how common or rare a species is relative to other species in a defined location or community. Relative species abundances tend to conform to specific patterns that are among the best-known and most-studied patterns in macroecology. ...
Relative species abundance distributions are usually graphed as frequency histograms (“Preston Plots”) or rank-abundance diagrams ("Whittaker Plots”)." [Relative species abundance. Wikipedia]
The frequency histogram example "Beetles in the river Thames" was created using the ConceptDraw PRO diagramming and vector drawing software extended with the Histograms solution from the Graphs and Charts area of ConceptDraw Solution Park.
- Beetles in the river Thames | How Do You Make a Histogram ...
- Beetles in the river Thames | Landmarks - Vector stencils library ...
- Diagram Of Biodiversity
- Histogram For Sources Of Energy
- Histograms - Vector stencils library | How to Draw a Histogram in ...
- Beetles in the river Thames - Frequency histogram | How Do You ...
- Beetles in the river Thames - Frequency histogram | Preston
- Beetles in the river Thames | Relative Species Abundance
- Geography - Vector stencils library | Map of Germany — Hamburg ...
- Histograms Solution
- Chart Examples | How to Draw a Histogram in ConceptDraw PRO ...
- Wind speed histogram | Weather - Vector stencils library | Resources ...
- Health Food | Pie Chart And Histogram On On Bio Diversity
- Beetles in the river Thames | Geo Map - Europe - Bulgaria | Geo ...
- LLNL Flow Charts | Picture Graphs | Manufacturing and ...
- LLNL Flow Charts | Resources and energy - Vector stencils library ...
- Resources and energy - Vector stencils library | Geothermal Energy ...
- Resources and energy - Vector stencils library | Healthy Diet Plan ...
- Resources and energy - Vector stencils library | Geography - Vector ...
