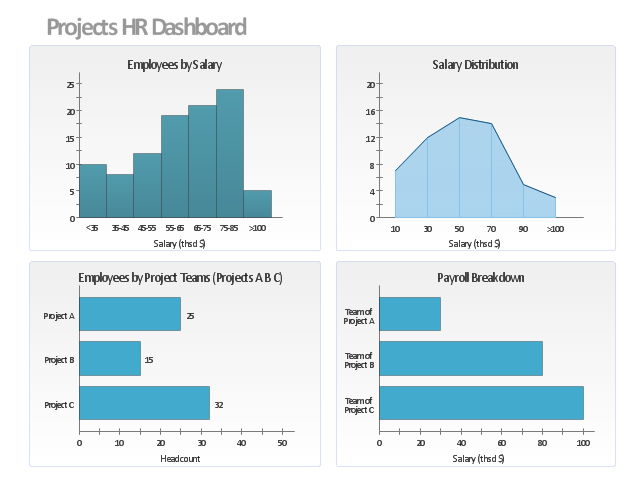
This projects HR dashboard example includes the histogram of employees distribution by salary, the area chart of salari distribution, and two horizontal bar charts: "Employees by Project Teams" and "Payroll Breakdown".
"Project Portfolio Management (PPM) is the centralized management of processes, methods, and technologies used by project managers and project management offices (PMOs) to analyze and collectively manage a group of current or proposed projects based on numerous key characteristics. The objectives of PPM are to determine the optimal resource mix for delivery and to schedule activities to best achieve an organization’s operational and financial goals ― while honouring constraints imposed by customers, strategic objectives, or external real-world factors. ... With PPM, the Office of Finance can improve their accuracy for estimating and managing the financial resources of a project or group of projects. In addition, the value of projects can be demonstrated in relation to the strategic objectives and priorities of the organization through financial controls and to assess progress through earned value and other project financial techniques." [Project portfolio management. Wikipedia]
The example "Projects HR dashboard" was created using the ConceptDraw PRO diagramming and vector drawing software extended with the Frequency Distribution Dashboard solution from the area "What is a Dashboard" of ConceptDraw Solution Park.
Best Program to Make Flow Chart Diagrams
ConceptDraw the best business process modeling tool to make flow chart diagrams. Start creating your own flowchart with ConceptDraw DIAGRAM and accomplish great results in the moment. This is the best program to make flow chart diagrams that gives users the ability to simply draw any type of flowchart. The fast creating visualization for the structural data with the vector stencils from object libraries by using RapidDraw technology makes ConceptDraw DIAGRAM the first program in drawing flow data.How to Simplify Flow Charting — Cross-functional Flowchart
In ConceptDraw DIAGRAM it really is sp simple to draw even the most complex cross-functional flowcharts. Use the RapidDraw technology and Cross-Functional libraries in ConceptDraw DIAGRAM for the best results.Best Flowchart Software and Flowchart Symbols
For many years ConceptDraw Solution Park delivers a great quantity of high-quality business process flowchart and flow diagram solutions, which are turned the ConceptDraw DIAGRAM into the most comprehensive and powerful software. Now it is an example of the best professional flowchart software available with extensive set of solutions, including the Flowcharts solution. The ConceptDraw solutions contain thousands of standard basic and creative flowchart symbols and other design elements, numerous quick-start templates, samples and examples. ConceptDraw DIAGRAM diagramming and vector graphics software includes specific drawing tools that you need to easily design the flowcharts and diagrams of any complexity and degree of detailing. Use ConceptDraw DIAGRAM to draw your own diagrams, charts, graphs and flowcharts for graphic communication, simple visual presentation of complex structures, numerical data and logical relations, explanation business and personal ideas and concepts, representation step-by-step flows of actions or operations, etc.
 Workflow Diagrams
Workflow Diagrams solution extends ConceptDraw DIAGRAM software with samples, templates and vector stencils library for drawing the work process flowcharts.
 ATM UML Diagrams
The ATM UML Diagrams solution lets you create ATM solutions and UML examples. Use ConceptDraw DIAGRAM as a UML diagram creator to visualize a banking system.
- Examples of Flowcharts, Org Charts and More | Histograms | Seven ...
- Frequency Distribution Dashboard | ConceptDraw Solution Park ...
- Projects HR dashboard | Salary Dashboard
- Dashboard With Histogram
- Frequency Distribution Dashboard | Design elements - Frequency ...
- Employee distribution - HR dashboard | HR dashboard | Projects HR ...
- HR dashboard | Projects HR dashboard | Frequency Distribution ...
- Employee distribution - HR dashboard | Projects HR dashboard | HR ...
- HR dashboard | Projects HR dashboard | Employee distribution - HR ...
- ConceptDraw Solution Park | HR Flowcharts | Bar Graphs | Hr ...
- Projects HR dashboard | Cross-Functional Flowcharts | HR ...
- Projects HR dashboard | Competitor Analysis | Six Markets Model ...
- Projects HR dashboard | Competitor Analysis | BCG Matrix | Project ...
- Support calls by products - Visual dashboard | Sales Dashboards for ...
- How to Create a HR Process Flowchart Using ConceptDraw PRO ...
- Draw The Flow Chart To Find The Salary Of A Highly Paid Employee
- HR workflow - Vector stencils library | ERD Symbols and Meanings ...
- Design elements - Business | HR workflow - Vector stencils library ...
- Examples of Flowcharts, Org Charts and More | How to Draw an ...


