Histogram Chart
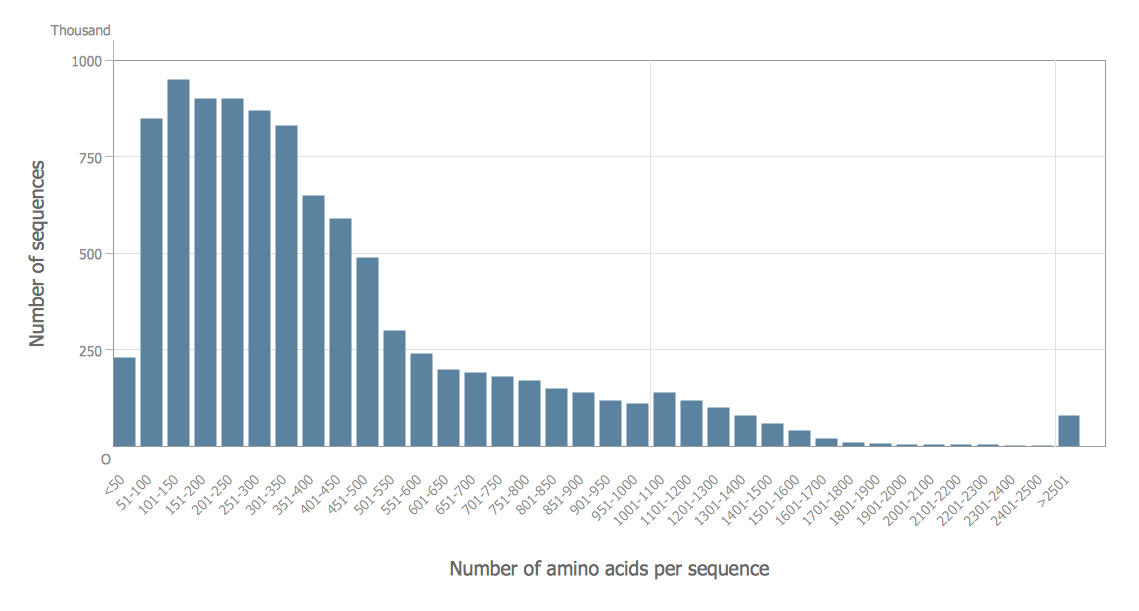
What is a Histogram Chart? It is a chart which visually displays a distribution of the data. ConceptDraw DIAGRAM extended with Histograms solution from the Graphs and Charts area of ConceptDraw Solution Park is the best software for fast and simple drawing professional looking Histogram Chart.Make a Histogram
ConceptDraw DIAGRAM extended with Histograms solution from the Graphs and Charts area of ConceptDraw Solution Park lets you make a Histogram of any complexity in minutes.How To Draw a Histogram?
How to draw a Histogram? It's very fast and easy to draw any Histogram using the tools of ConceptDraw DIAGRAM software extended with Histograms solution from the Graphs and Charts area of ConceptDraw Solution Park.HelpDesk
How to Draw a Histogram
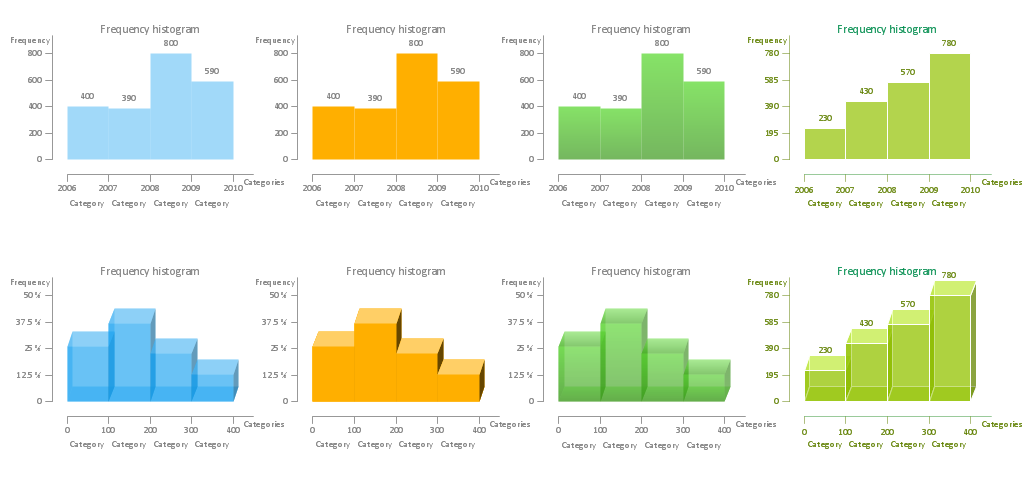
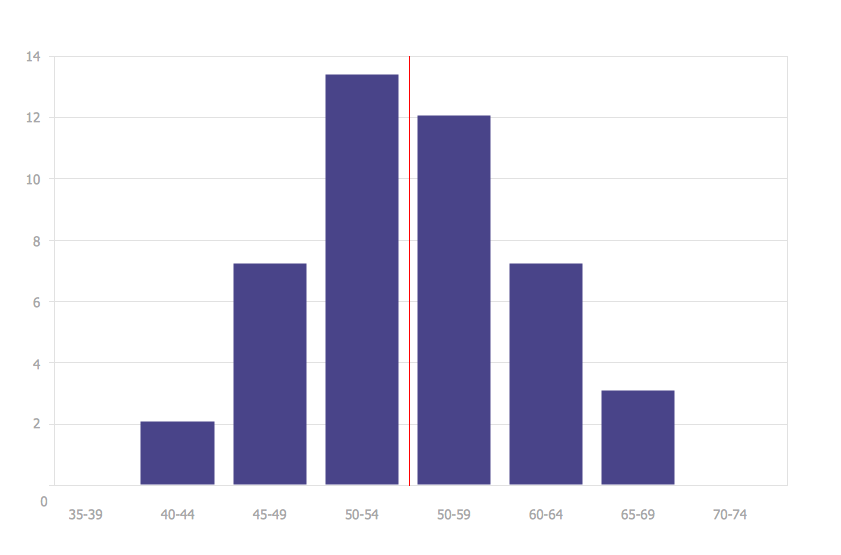
A histogram is a diagram used to visualize data through bars of variable heights. Making histogram can be helpful if you need to show data covering various periods (hours, days, weeks, etc). When the vertical column of the histogram refers to the frequency it shows how many times an event happens. It is a Frequency Histogram. A bar chart diagram is similar to a histogram, but in contrast to a bar chart, a histogram represents the number how many times there have been certain data values. You can use a histogram to depict continual data flow such as temperature, time, etc. You can effortlessly draw histograms using the Histograms solution for ConceptDraw DIAGRAM. Making a histogram can be very useful to represent various statistical data.Histogram
ConceptDraw DIAGRAM diagramming and vector drawing software offers the Histograms solution from the Graphs and Charts area of ConceptDraw Solution Park with powerful tools to help you draw a Histogram of any complexity quick and easy.
 Histograms
How to make a Histogram? Making a Histogram is an incredibly easy process when it is done with ConceptDraw DIAGRAM. The Histograms Solution enhances ConceptDraw DIAGRAM functionality with extensive drawing tools, numerous samples, and examples; also a quick-start template and library of ready vector stencils for visualization the data and professional drawing Histograms.
 Basic Histograms
This solution extends the capabilities of ConceptDraw DIAGRAM (or later) with templates, samples and a library of vector stencils for drawing Histograms.
How To Make a Histogram?
How to make a Histogram quick and easy? ConceptDraw DIAGRAM diagramming and vector drawing software extended with Histograms solution from the Graphs and Charts area will effectively help you in Histogram drawing.Making a Histogram
ConceptDraw DIAGRAM is a powerful diagramming and vector drawing software. Extended with Histograms solution from the Graphs and Charts area, ConceptDraw DIAGRAM became the ideal software for making a Histogram.Seven Basic Tools of Quality - Histogram
A histogram is a chart which visually displays a distribution of numerical data. ConceptDraw DIAGRAM diagramming and vector drawing software offers a powerful Seven Basic Tools of Quality solution from the Quality area of ConceptDraw Solution Park which contains a set of useful tools for easy drawing Histogram and other quality related diagrams of any complexity.- How to Draw a Pyramid Diagram in ConceptDraw PRO | Visio 3d
- Visio Pyramid Shape
- Cross-Functional Flowchart | Histograms | Visio 2013 Rectangle ...
- 3d Drawing In Visio
- How To Create a MS Visio Cause and Effect Diagram Using ...
- KPI Dashboard | Dashboard | Sales Dashboard | Dashboard Visio
- Histogram Chart | Make a Histogram | Histograms | What Is A ...
- Block Diagrams | In searching of alternative to MS Visio for MAC and ...
- 3d Visio Shape Chart


