 Bar Graphs
The Bar Graphs solution enhances ConceptDraw PRO v10 functionality with templates, numerous professional-looking samples, and a library of vector stencils for drawing different types of Bar Graphs, such as Simple Bar Graph, Double Bar Graph, Divided Bar Graph, Horizontal Bar Graph, Vertical Bar Graph, and Column Bar Chart.
Chart Examples
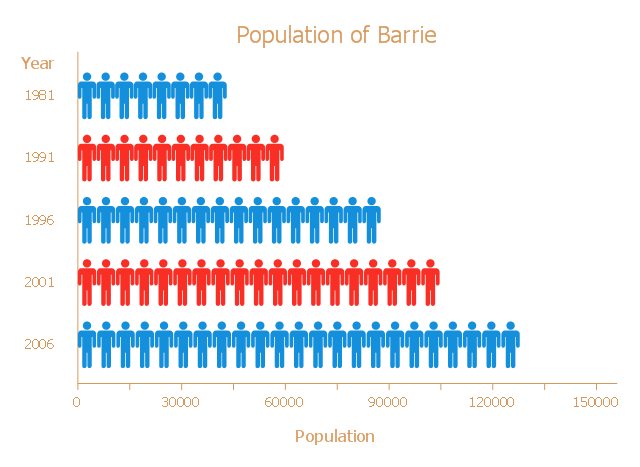
Easy charting software comes with beautiful chart templates and examples. This makes it easy to create professional charts without prior experience.This picture bar graph sample shows the Barrie population growth from 1981 to 2006. It was designed on the base of the Wikimedia Commons file: Barrie Population.jpg.
[commons.wikimedia.org/ wiki/ File:Barrie_ Population.jpg]
"Barrie is a city in Central Ontario, Canada, on the western shore of Lake Simcoe. Although located in Simcoe County, the city is politically independent. Barrie is within the northern part of the Greater Golden Horseshoe, a densely populated and industrialized region of Ontario.
In 2011 census, the city's population was originally reported as 135,711, making it the 34th largest in Canada. The city's 2011 population was subsequently revised to 136,063. The Barrie census metropolitan area (CMA) had a population of 187,013 residents, making it the 21st largest CMA in Canada." [Barrie. Wikipedia]
The pictorial chart example "Barrie population" was created using the ConceptDraw PRO diagramming and vector drawing software extended with the Picture Graphs solution from the Graphs and Charts area of ConceptDraw Solution Park.
Chart Templates
Easy charting software comes with beautiful chart templates and examples. This makes it easy to create professional charts without prior experience.Bar Diagrams for Problem Solving. Create event management bar charts with Bar Graphs Solution
Create bar charts for event management problem solving and visual data comparison using the ConceptDraw PRO diagramming and vector drawing software extended with the Bar Graphs Solution from the Graphs and Charts area of ConceptDraw Solition Park.Chart Maker for Presentations
Easy charting software comes with beautiful chart templates and examples. This makes it easy to create professional charts without prior experience.Bar Chart Software
The best bar chart software ever is ConceptDraw. ConceptDraw bar chart software provides an interactive bar charting tool and complete set of predesigned bar chart objects.How to Create a Bar Chart
The answer how to create a bar chart can be found in ConceptDraw software. The simple tips guide you through the software to quickly learn how to create a bar chart.Bar Graph
You need to draw the Bar Graph? The automated tool can be useful for you. ConceptDraw PRO diagramming and vector drawing software extended with Bar Graphs solution from Graphs and Charts area of ConceptDraw Solution Park will help you create any Bar Graph.Bar Chart
ConceptDraw PRO extended with Bar Graphs solution from Graphs and Charts area of ConceptDraw Solution Park is ideal software for quick and simple drawing bar chart of any complexity graph.- Barrie population - Picture bar graph | Design elements - Picture bar ...
- Bar Graph | Bar Diagrams for Problem Solving. Create ...
- Picture graph - Template | Picture Graph | Chart Maker for ...
- Barrie population - Picture bar graph | Computer and Internet use at ...
- Bar Graphs | Sales Growth. Bar Graphs Example | Rainfall Bar Chart ...
- Image chart - The total financing of the Philippines from 2001-2010 ...
- Line Graph | Population growth by continent | Line Chart Examples ...
- Design elements - Picture bar graphs | Picture graphs - Vector ...
- Chart Examples | Sales Growth. Bar Graphs Example | Business ...
- Rainfall Bar Chart | Chart Maker for Presentations | Picture Graph ...


