 House of Quality
House of Quality solution provides the powerful drawing tools, numerous specific samples and examples, and set of vector design elements of House of Quality shapes and symbols, which will help you in application the Quality function deployment (QFD) methodology and in easy creation the House of Quality Matrices intended for satisfaction the consumers' desires and requirements, for representing them in a visual way and then transformation into the targets and technical requirements to be followed for development the best products.
PROBLEM ANALYSIS. Prioritization Matrix
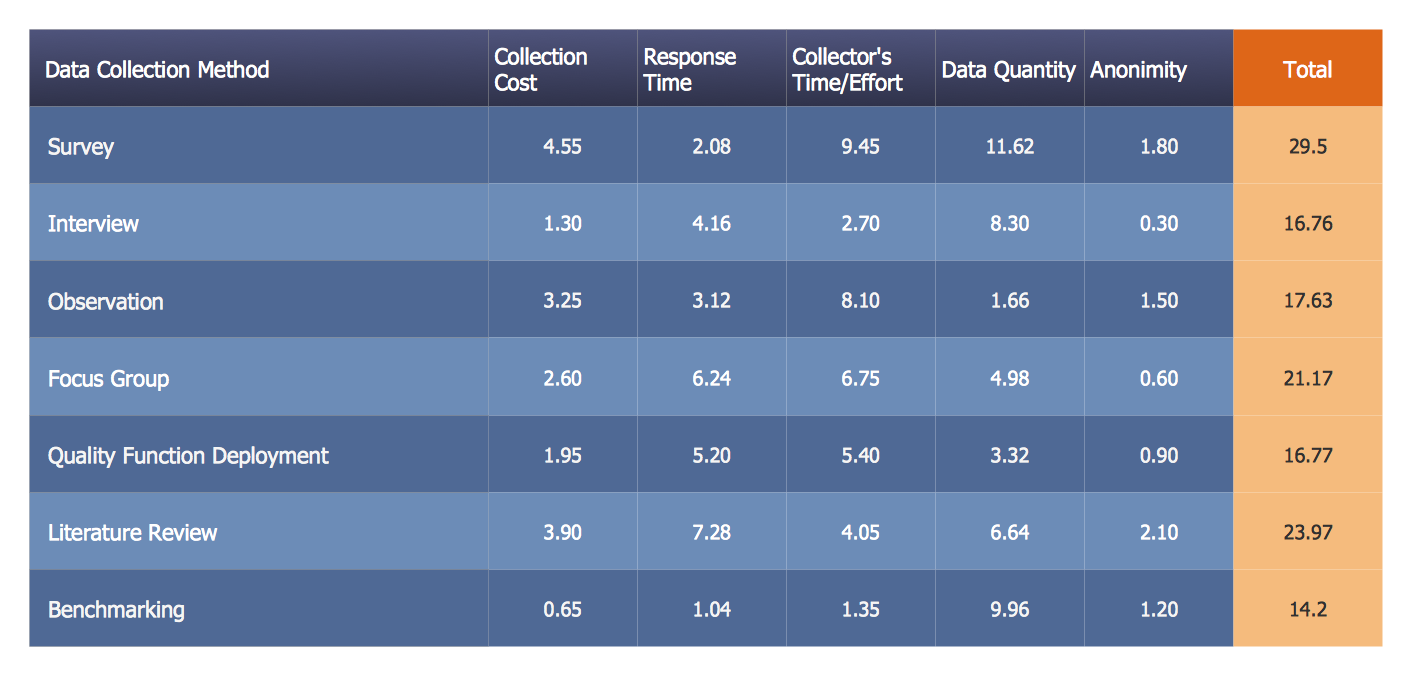
ConceptDraw OFFICE suite is a software for Prioritization Matrix diagram making. This diagram ranks the drivers’ factors to determine priority. It identifies the factors of the first priority for analysis of possible corrective actions. It assesses the weight of each factor for each criterion and specifies it in the Prioritization Matrix. The total sum of weights for a factor’s criteria indicates its priority.
Types of Flowcharts
A Flowchart is a graphical representation of process, algorithm, workflow or step-by-step solution of the problem. It shows the steps as boxes of various kinds and connects them by arrows in a defined order depicting a flow. There are twelve main Flowchart types: Basic Flowchart, Business Process Modeling Diagram (BPMN), Cross Functional Flowchart, Data Flow Diagram (DFD), IDEF (Integrated DEFinition) Flowchart, Event-driven Process Chain (EPC) Diagram, Influence Diagram (ID), Swimlane Flowchart, Process Flow Diagram (PFD), Specification and Description Language (SDL) Diagram, Value Stream Mapping, Workflow Diagram. Using the Flowcharts solution from the Diagrams area of ConceptDraw Solution Park you can easy and quickly design a Flowchart of any of these types. This solution offers a lot of special predesigned vector symbols for each of these widely used notations. They will make the drawing process of Flowcharts much easier than ever. Pay also attention for the included collection of ready Flowchart examples, samples and quick-start templates. This is business process improvement tools. If you are looking for MS Visio for your Mac, then you are out of luck, because it hasn't been released yet. However, you can use Visio alternatives that can successfully replace its functions. ConceptDraw DIAGRAM is an alternative to MS Visio for Mac that provides powerful features and intuitive user interface for the same.
 Seven Basic Tools of Quality
Manage quality control in the workplace, using fishbone diagrams, flowcharts, Pareto charts and histograms, provided by the Seven Basic Tools of Quality solution.
Affinity Diagram Software
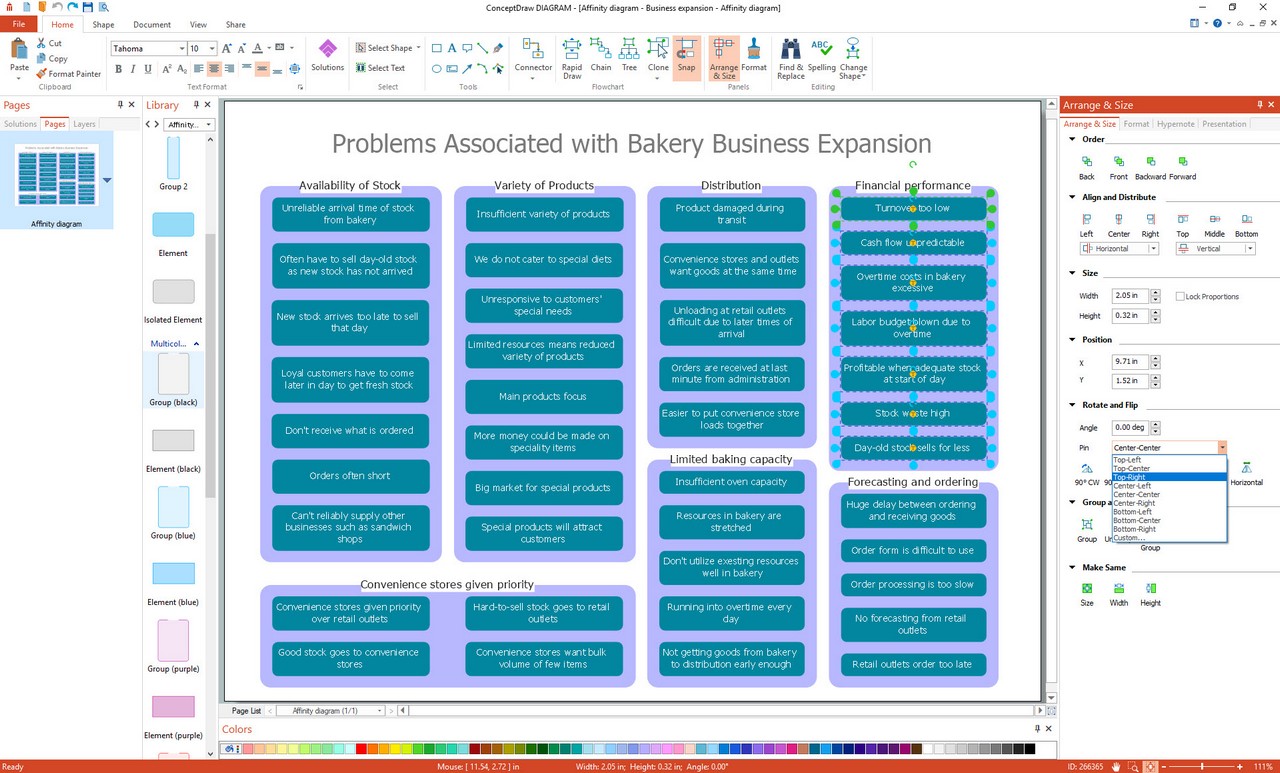
Affinity Diagram Software - ConceptDraw DIAGRAM is a powerful diagramming and vector drawing software that allows quick, easy and effective create the Affinity Diagrams. Seven Management and Planning Tools solution from the Business Productivity area of ConceptDraw Solution Park provides templates, samples and ready-to-use vector stencils that will help you design the professional looking Affinity Diagrams in a few moments.
 Quality Mind Map
This solution extends ConceptDraw MINDMAP software with Quality Management Mind Maps (Presentations, Meeting Agendas, Problem to be solved).
 Total Quality Management TQM Diagrams
Total Quality Management Diagrams solution extends ConceptDraw DIAGRAM software with samples, templates and vector stencils library for drawing the TQM flowcharts.
SysML
Systems Modeling Language (SysML) is a general-purpose modeling language for systems engineering applications. ConceptDraw DIAGRAM diagramming and vector drawing software was extended with SysML Solution from the Software Development Area of ConceptDraw Solution Park specially to help systems engineers design various model systems with SysML.Network Diagram Software Home Area Network
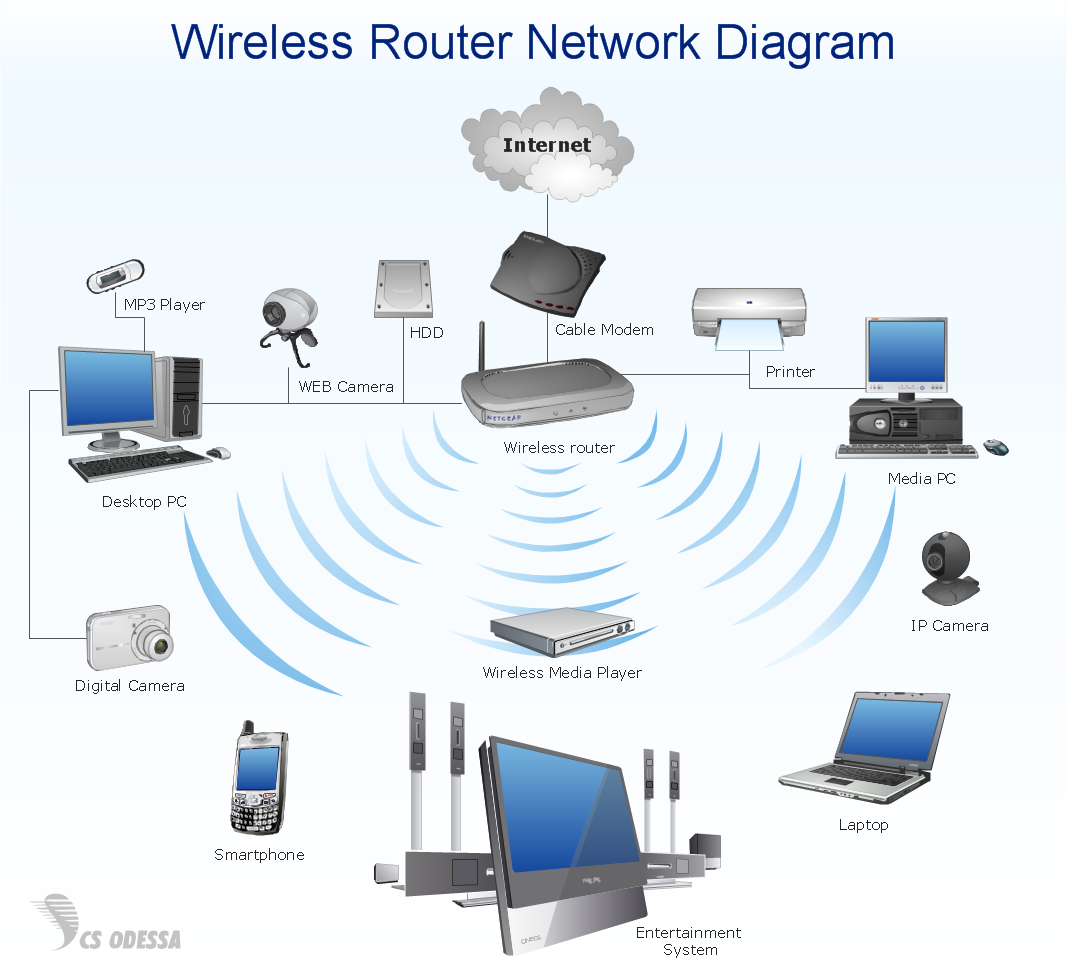
A Home Area Network (HAN) is a type of computer network which provides a communication between devices in neighborhood of a home. For construction a HAN are used modem, router, network switch, wireless access point, home automation controller, network bridge, and also various smart devices, network printers, handheld mobile computers, etc. All these devices are capable efficiently interact each other and so give wide possibilities for automation the execution of repetitious tasks, increasing a home security, improvement quality of life inside a home, enhancement a personal productivity, and also make easier an access to entertainment. Home Area Networks can be constructed using a wired or wireless technologies to connect endpoints. Wireless is predominant for homes due to the ease of its installation and absence of unsightly cables. ConceptDraw DIAGRAM software extended with Computer Network Diagrams solution lets easy visualize the communication schemes of Home Area Networks and illustrate the networks arrangement in houses on the Home Area Network Diagrams.
- Seating Plans | House Of Quality Diagram For Ipad
- Project Management Diagram House
- How To use House Plan Software | How To use House Electrical ...
- How To use House Electrical Plan Software | House of Quality Matrix ...
- Conceptdraw.com: Mind Map Software, Drawing Tools | Project ...
- PROBLEM ANALYSIS. Prioritization Matrix | Matrix Organization ...
- How To use House Plan Software | How To use Building Plan ...
- Prioritisation Matrix In Quality Assurance And Their Examples
- Top iPad Business Process Diagrams Apps | Business Matrix Symbols
- Business diagrams & Org Charts with ConceptDraw PRO | Building ...


