Network Diagram Software
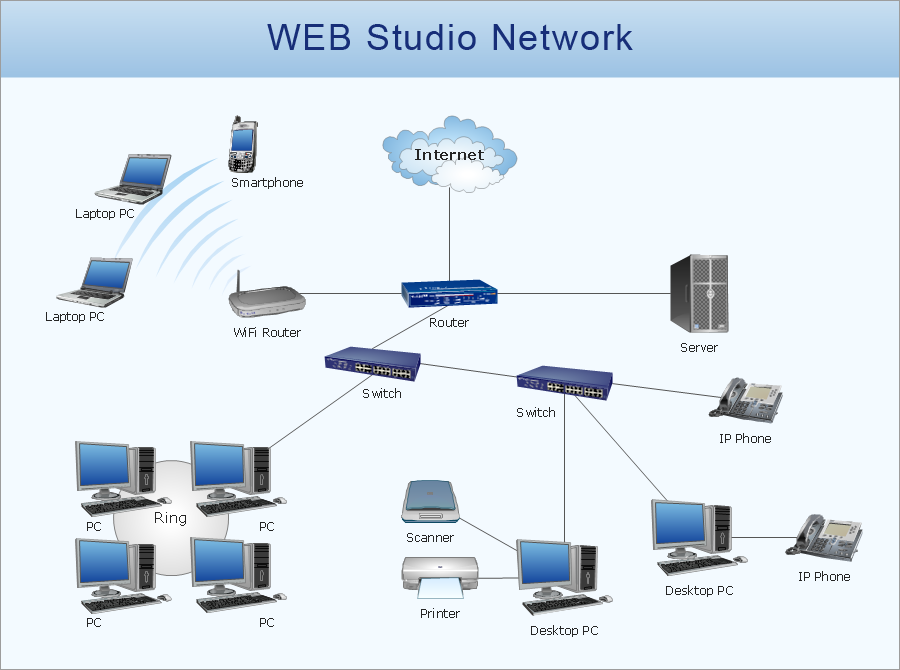
Network Diagrams are used to visually represent the network architecture, to illustrate the network structure, how the computers and other elements of the network are connected each other using a variety of network symbols, clipart and connection lines. They are incredibly useful on the stages of projecting computer network, of its construction and exploitation. Professionally designed and accurate Network Diagrams are equally convenient for computer engineers and users. You can construct them by hand on the paper or use special network diagramming software, such as ConceptDraw DIAGRAM. Having at disposal the powerful network diagramming tools of Computer Network Diagrams solution included to ConceptDraw Solution Park, you can succeed in drawing various types of Computer Network Diagrams, among them Network Communication Plans, Logical Network Diagrams, Network Topology Diagrams, LAN and WAN Diagrams, Network Floor Plan Layouts, Computer Network System Diagrams, Web-based Network Diagrams, Wireless Network Diagrams, Cisco Network Diagram, and others.
 ConceptDraw Solution Park
ConceptDraw Solution Park collects graphic extensions, examples and learning materials
 Floor Plans
Construction, repair and remodeling of the home, flat, office, or any other building or premise begins with the development of detailed building plan and floor plans. Correct and quick visualization of the building ideas is important for further construction of any building.
 Plumbing and Piping Plans
Plumbing and Piping Plans solution extends ConceptDraw DIAGRAM.2.2 software with samples, templates and libraries of pipes, plumbing, and valves design elements for developing of water and plumbing systems, and for drawing Plumbing plan, Piping plan, PVC Pipe plan, PVC Pipe furniture plan, Plumbing layout plan, Plumbing floor plan, Half pipe plans, Pipe bender plans.
Business diagrams & Org Charts with ConceptDraw DIAGRAM
The business diagrams are in great demand, they describe the business processes, business tasks and activities which are executed to achieve specific organizational and business goals, increase productivity, reduce costs and errors. They let research and better understand the business processes. ConceptDraw DIAGRAM is a powerful professional cross-platform business graphics and business flowcharting tool which contains hundreds of built-in collections of task-specific vector stencils and templates. They will help you to visualize and structure information, create various Business flowcharts, maps and diagrams with minimal efforts, and add them to your documents and presentations to make them successful. Among them are Data flow diagrams, Organization charts, Business process workflow diagrams, Audit flowcharts, Cause and Effect diagrams, IDEF business process diagrams, Cross-functional flowcharts, PERT charts, Timeline diagrams, Calendars, Marketing diagrams, Pyramids, Target diagrams, Venn diagrams, Comparison charts, Analysis charts, Dashboards, and many more. Being a cross-platform application, ConceptDraw DIAGRAM is very secure, handy, free of bloatware and one of the best alternatives to Visio for Mac users.
 Fault Tree Analysis Diagrams
This solution extends ConceptDraw DIAGRAM.5 or later with templates, fault tree analysis example, samples and a library of vector design elements for drawing FTA diagrams (or negative analytical trees), cause and effect diagrams and fault tree diagrams.
- Fishbone Diagram | HR Management Software | House of Quality ...
- Fishbone Diagram | House of Quality Matrix Software | HR ...
- Process Flowchart | House of Quality Matrix Software | How Do ...
- Types of Flowcharts | House of Quality Matrix Software | Fishbone ...
- Process Flowchart | How Do Fishbone Diagrams Solve ...
- House of Quality Matrix Software | Fishbone Diagrams | Bar Graphs ...
- Pdf On Quality Control Concept Like Fish Bone Diagram
- TQM Diagram Tool | House of Quality Matrix Software | Probability ...
- House of Quality Matrix Software | Probability Quality Control Tools ...
- House of Quality Matrix Software | TQM Diagram Example | Seven ...
- Cause and Effect Diagrams | Process Flowchart | House of Quality ...
- House of Quality Matrix Software | Total Quality Management ...
- Fishbone Diagram Problem Solving | Using Fishbone Diagrams for ...
- Fishbone Diagrams | SWOT Analysis Software | Fishbone Diagram ...
- SWOT Matrix Template | Process Flowchart | House of Quality Matrix ...
- Cause and Effect Analysis | Timeline Diagrams | House of Quality ...
- Total Quality Management Value | Seven Basic Tools of Quality ...
- Project Timeline | Online Collaboration via Skype | House of Quality ...
- 7 Tools For Quality Example
- Total Quality Management TQM Diagrams | Cross-functional ...

