SWOT Sample in Computers
SWOT analysis is an effective method of making the plan for evaluation the Strengths, Weaknesses, Opportunities, and Threats that are involved in a project. It is actively applied in business sphere and helps define the objective of the project. It lets detect and represent the external and internal causes for the accomplishing the project goals and business purposes, and also plays important role in formation successful and perspective business. ConceptDraw DIAGRAM is a perfect diagramming software which nicely suits for SWOT analysis and representation its results in the form of SWOT diagrams of different complexity and design, thanks to the included SWOT and TOWS Matrix Diagrams solution from Management area of ConceptDraw Solution Park. This solution contains a lot of specially designed SWOT templates, SWOT matrix samples (SWOT analysis sample, SWOT sample in computers, SWOT matrix for business sphere, SWOT matrix educational, and many others), and also ready SWOT matrix objects that allow users create their own SWOT diagrams in minutes.Competitor Analysis
Competitor analysis is a first and obligatory step in elaboration the proper corporate marketing strategy and creating sustainable competitive advantage. Use powerful opportunities of numerous solutions from ConceptDraw Solution Park for designing illustrative diagrams, charts, matrices which are necessary for effective competitor analysis.Fishbone Diagram Template
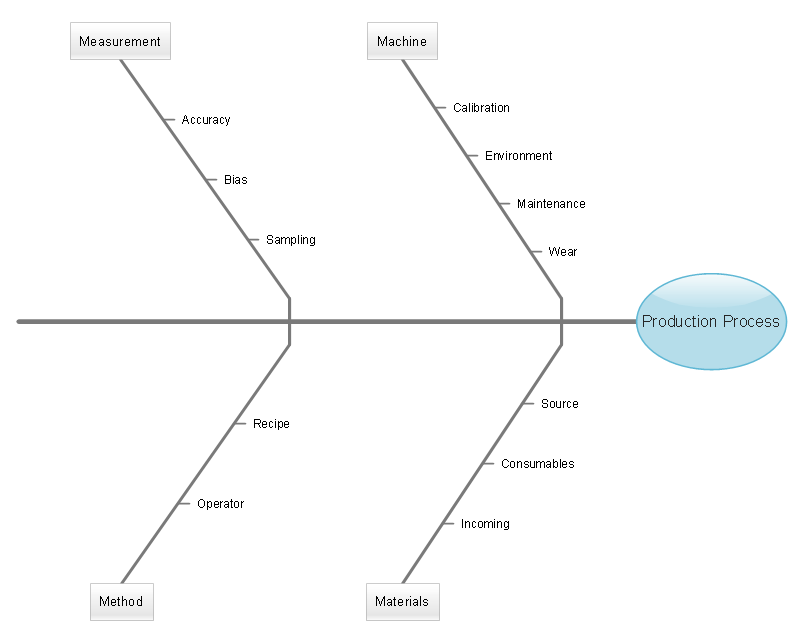
A causal model is an abstract concept, that describes the causal mechanisms of a system, by noting certain variables and their influence on each other, in an effort to discover the cause of a certain problem or flaw. This model is presented in diagram form by using a fishbone diagram. ConceptDraw DIAGRAM diagramming and vector drawing software enhanced with Fishbone Diagrams solution helps you create business productivity diagrams from Fishbone diagram templates and examples, that provide to start using of the graphic method for the analysis of problem causes. Each predesigned Fishbone Diagram template is ready to use and useful for instantly drawing your own Fishbone Diagram.Venn Diagram Examples for Problem Solving. Environmental Social Science. Human Sustainability Confluence
The Venn diagram example below shows sustainable development at the confluence of three constituent parts. Create your Venn diagrams for problem solving in environmental social science using the ConceptDraw DIAGRAM diagramming and vector drawing software extended with the Venn Diagrams solution from the area "Diagrams" of ConceptDraw Solution Park.Fishbone Diagram
The use of specific types of visual diagrams is effective way to problems solving and decisions making. Fishbone diagram is a graphical tool used for visual and systematical analyzing the relationships between the solved problem and causes affecting its occurrence. It has hierarchical structure and that's why is well-suited for capturing in a mind map for a process of reviewing what branch is a real root cause of a given issue. ConceptDraw Office products and PM solutions offered by ConceptDraw STORE give the powerful help in questions of planning and project management. ConceptDraw DIAGRAM and ConceptDraw MINDMAP applications perfectly suit for designing professional-looking Fishbone Diagrams and allow effectively identify the root causes of quality issues using the Fishbone diagrams. The PM Response solution from the Project Management area of ConceptDraw Solution Park is powerful for improvement the response time to project changes, helps with iteration planning, with solving project challenges and discussing project layout approaches.
 Workflow Diagrams
Workflow Diagrams solution extends ConceptDraw DIAGRAM software with samples, templates and vector stencils library for drawing the work process flowcharts.
 Block Diagrams
Block diagrams solution extends ConceptDraw DIAGRAM software with templates, samples and libraries of vector stencils for drawing the block diagrams.
Pyramid Diagram
Pyramid chart example is included in the Pyramid Diagrams solution from Marketing area of ConceptDraw Solution Park.
 Customer Journey Mapping
Customer Journey Mapping Solution for ConceptDraw DIAGRAM opens incredibly broad opportunities for marketing and business specialists, product managers, designers, engineers, and other people interested in business development, increasing the product’s audience, its success and users' demand, providing them with capabilities of customer journey mapping. The included diagramming and customer journey mapping tools, predesigned vector customer journey mapping icons and charts, consumer journey mapping connectors, user journey and customer mapping figures, customer experience map icons and touchpoint icons, quick-start templates and samples provide excellent conditions for the customer journey mapping process, for creating Customer Journey Map and Customer Experience Map.
 Quality Mind Map
This solution extends ConceptDraw MINDMAP software with Quality Management Mind Maps (Presentations, Meeting Agendas, Problem to be solved).
- How Is Swot Principle Use In Identifying A Business Opportunity
- Value Chain Template
- Path to sustainable development | SWOT Analysis | SWOT Analysis ...
- Porter's Value Chain | Value stream map - Template | Matrices ...
- Path to sustainable development | Bar Diagrams for Problem ...
- Softness Presentation | SWOT Analysis | Competitor Analysis ...
- Marketing infographics - Market research | Tool for Workgroup ...
- Total Quality Management Value | Cause and Effect Analysis ...
- Sales Growth. Bar Graphs Example | Bar Diagrams for Problem ...
- Euclidean algorithm - Flowchart | SWOT Template | Draw A ...


