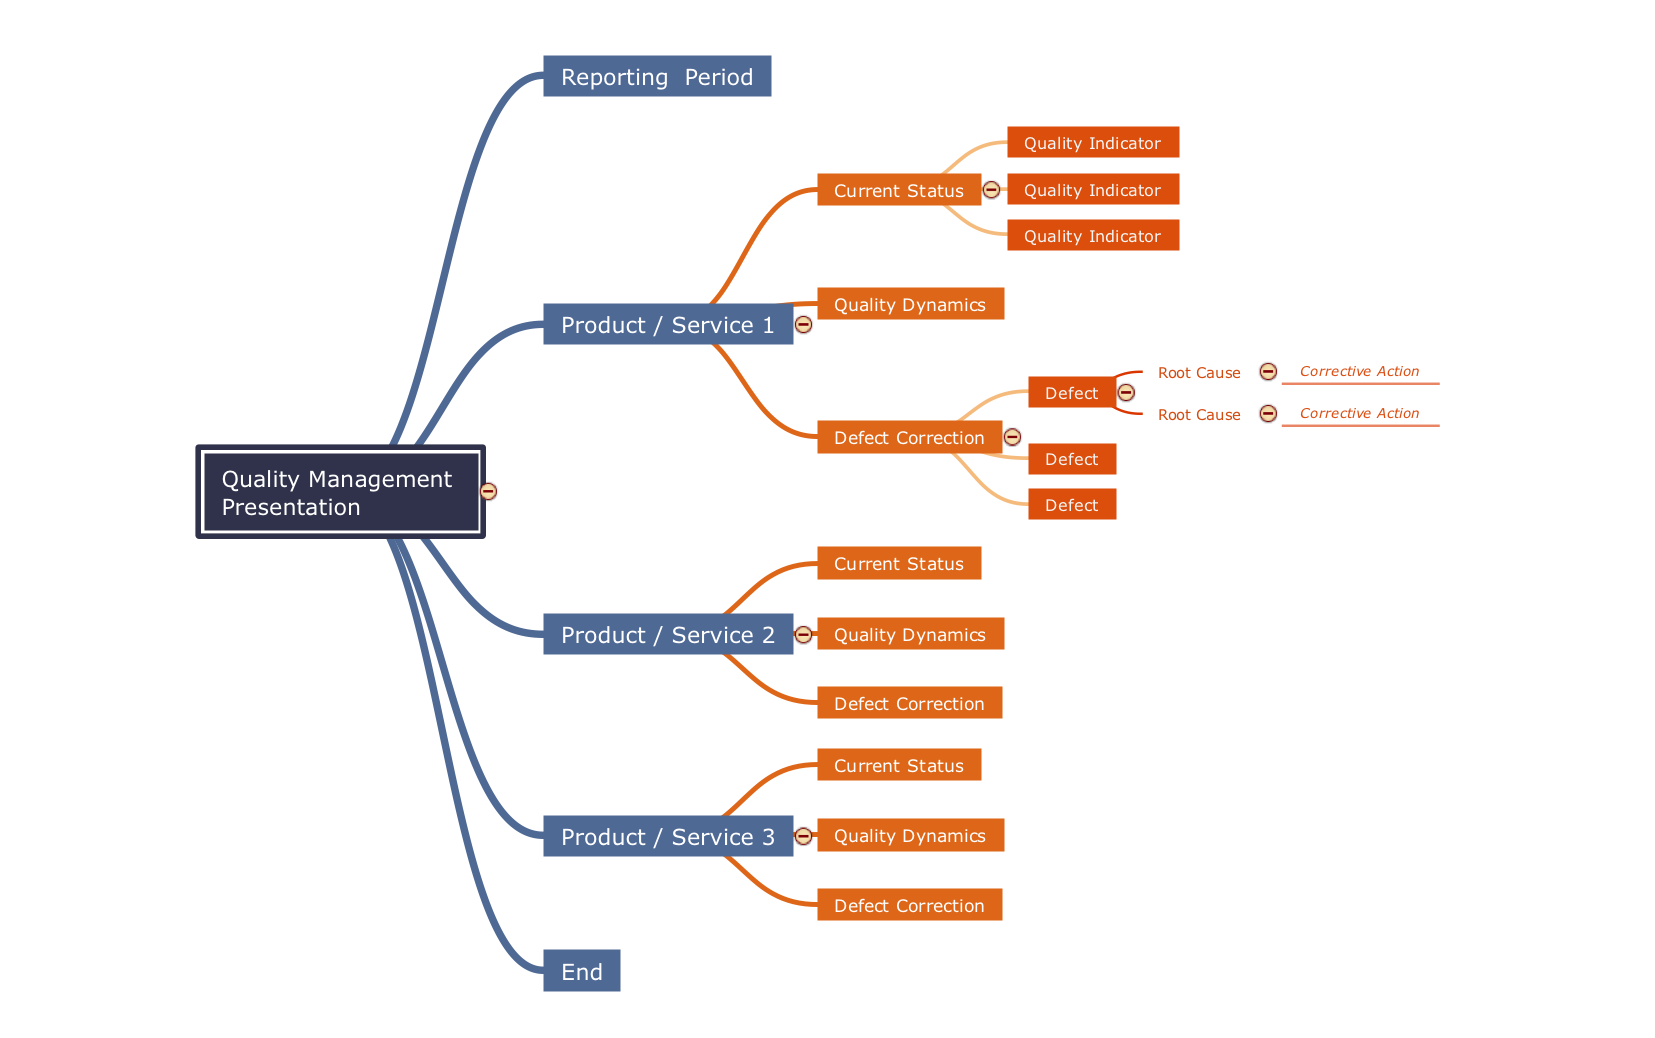
Quality Management System
ConceptDraw PRO diagramming and vector drawing software extended with Total Quality Management (TQM) Diagrams solution from the Quality area of ConceptDraw Solution Park perfectly suits for development and visually representing a Quality Management System.Process Flowchart
The main reason of using Process Flowchart or PFD is to show relations between major parts of the system. Process Flowcharts are used in process engineering and chemical industry where there is a requirement of depicting relationships between major components only and not include minor parts. Process Flowcharts for single unit or multiple units differ in their structure and implementation. ConceptDraw PRO is Professional business process mapping software for making Process flowcharts, Process flow diagram, Workflow diagram, flowcharts and technical illustrations for business documents and also comprehensive visio for mac application. Easier define and document basic work and data flows, financial, production and quality management processes to increase efficiency of your business with ConcepDraw PRO. Business process mapping software with Flowchart Maker ConceptDraw PRO includes extensive drawing tools, rich examples and templates, process flowchart symbols and shape libraries, smart connectors that allow you create the flowcharts of complex processes, process flow diagrams, procedures and information exchange. Process Flowchart Solution is project management workflow tools which is part ConceptDraw Project marketing project management software. Drawing charts, diagrams, and network layouts has long been the monopoly of Microsoft Visio, making Mac users to struggle when needing such visio alternative like visio for mac, it requires only to view features, make a minor edit to, or print a diagram or chart. Thankfully to MS Visio alternative like ConceptDraw PRO software, this is cross-platform charting and business process management tool, now visio alternative for making sort of visio diagram is not a problem anymore however many people still name it business process visio tools.
Identifying Quality Management System
The Total Quality Management Diagram solution helps your organization visualize business and industrial processes. Create Total Quality Management diagrams for business process with ConceptDraw software.Context Diagram Template
This template shows the Context Diagram. It was created in ConceptDraw PRO diagramming and vector drawing software using the Block Diagrams Solution from the “Diagrams” area of ConceptDraw Solution Park. The context diagram graphically identifies the system. external factors, and relations between them. It’s a high level view of the system. The context diagrams are widely used in software engineering and systems engineering for designing the systems that process the information.
Total Quality Management Value
The Total quality management (TQM) is an enterprise-wide method of continuous quality improvement of all organizational processes, including the enhancement of ability to deliver high-quality products and services to the customers. The TQM includes eight main elements, which have great value: customer-focused, process-centered, total employee involvement, integrated system, continual improvement, strategic and systematic approach, fact-based decision making, communications. ConceptDraw PRO diagramming and vector drawing software offers the Total Quality Management Diagram solution with effective drawing tools, predesigned vector elements, samples and templates that help easy design the Total Quality Management diagrams, TQM flowcharts and Mind Maps widely used in quality management projects to visualize the business processes and industrial processes for your organization, to demonstrate the quality control step-by-step in a visual manner, to compare visually the ideal and real stages of processes.Diagramming Software for Design UML Timing Diagrams
UML Timing Diagram as special form of a sequence diagram are used to explore the behaviors of objects throughout a given period of time.
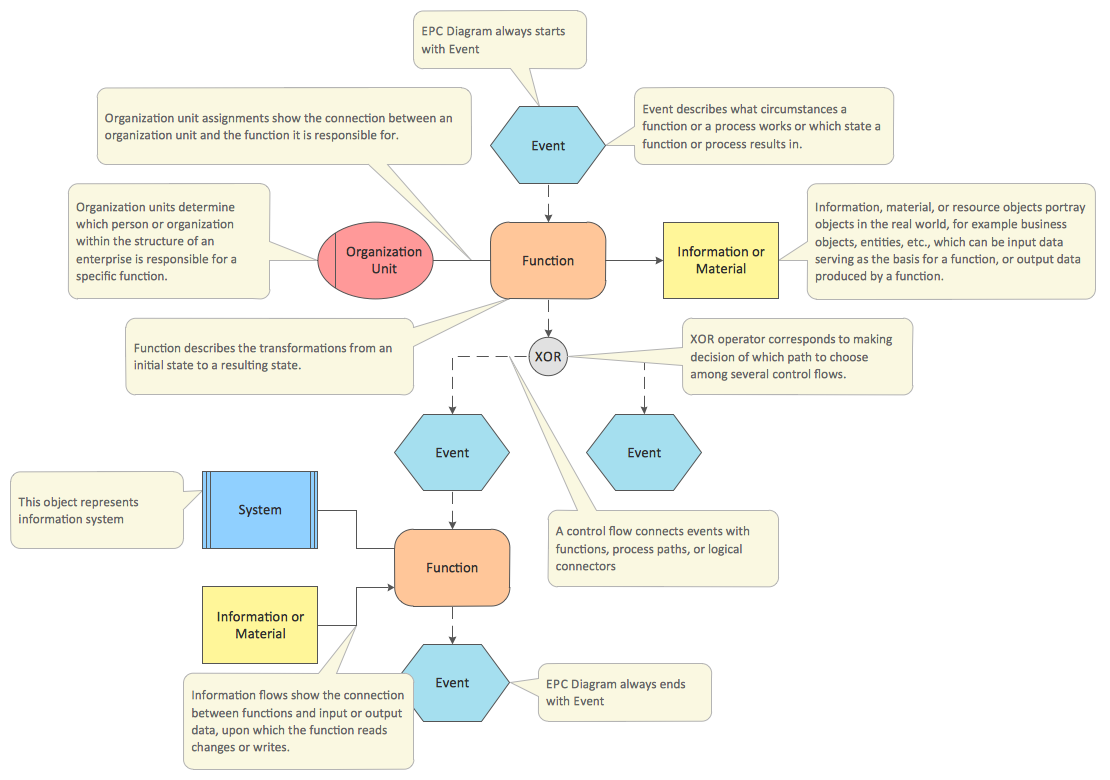
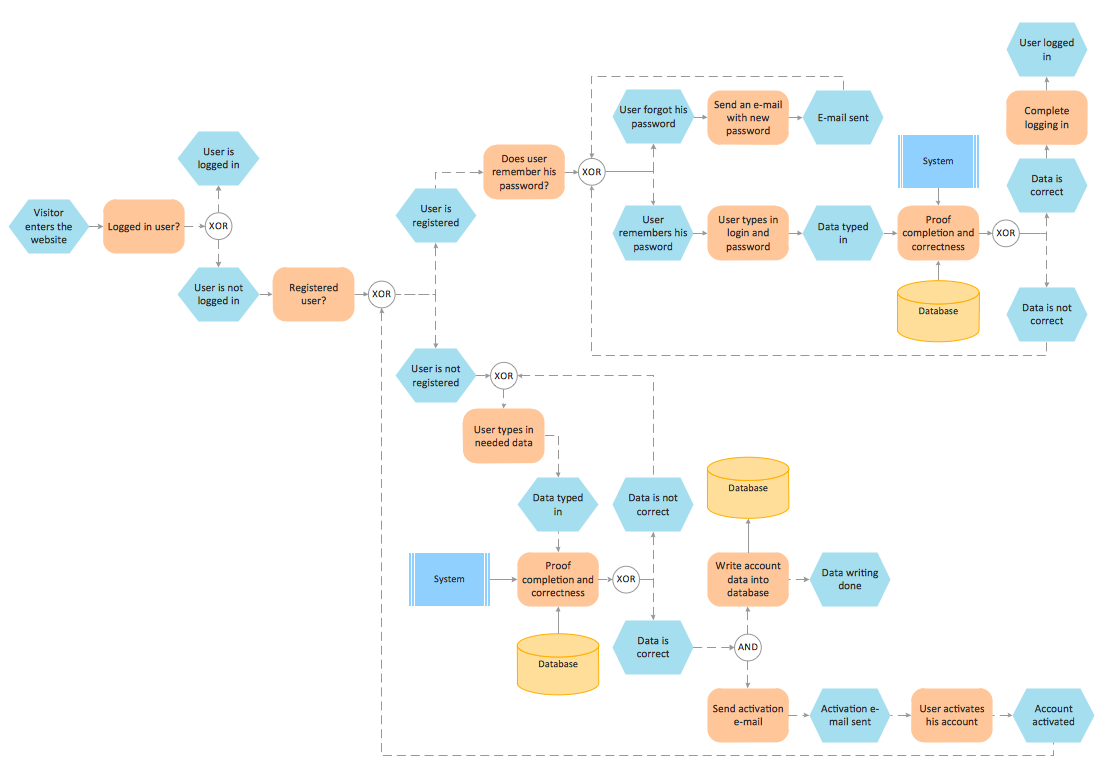
Why do we Need EPC Diagrams
Event-Driven Process chain Diagrams for improvement throughout an organisation. ConceptDraw PRO - software that reduces the time needed to create a business process model.eLearning for Leadership
Digital Learning Tools & Technologies. Online training with Skype for effective classrooms. Changing perceptions of leadership and learning.
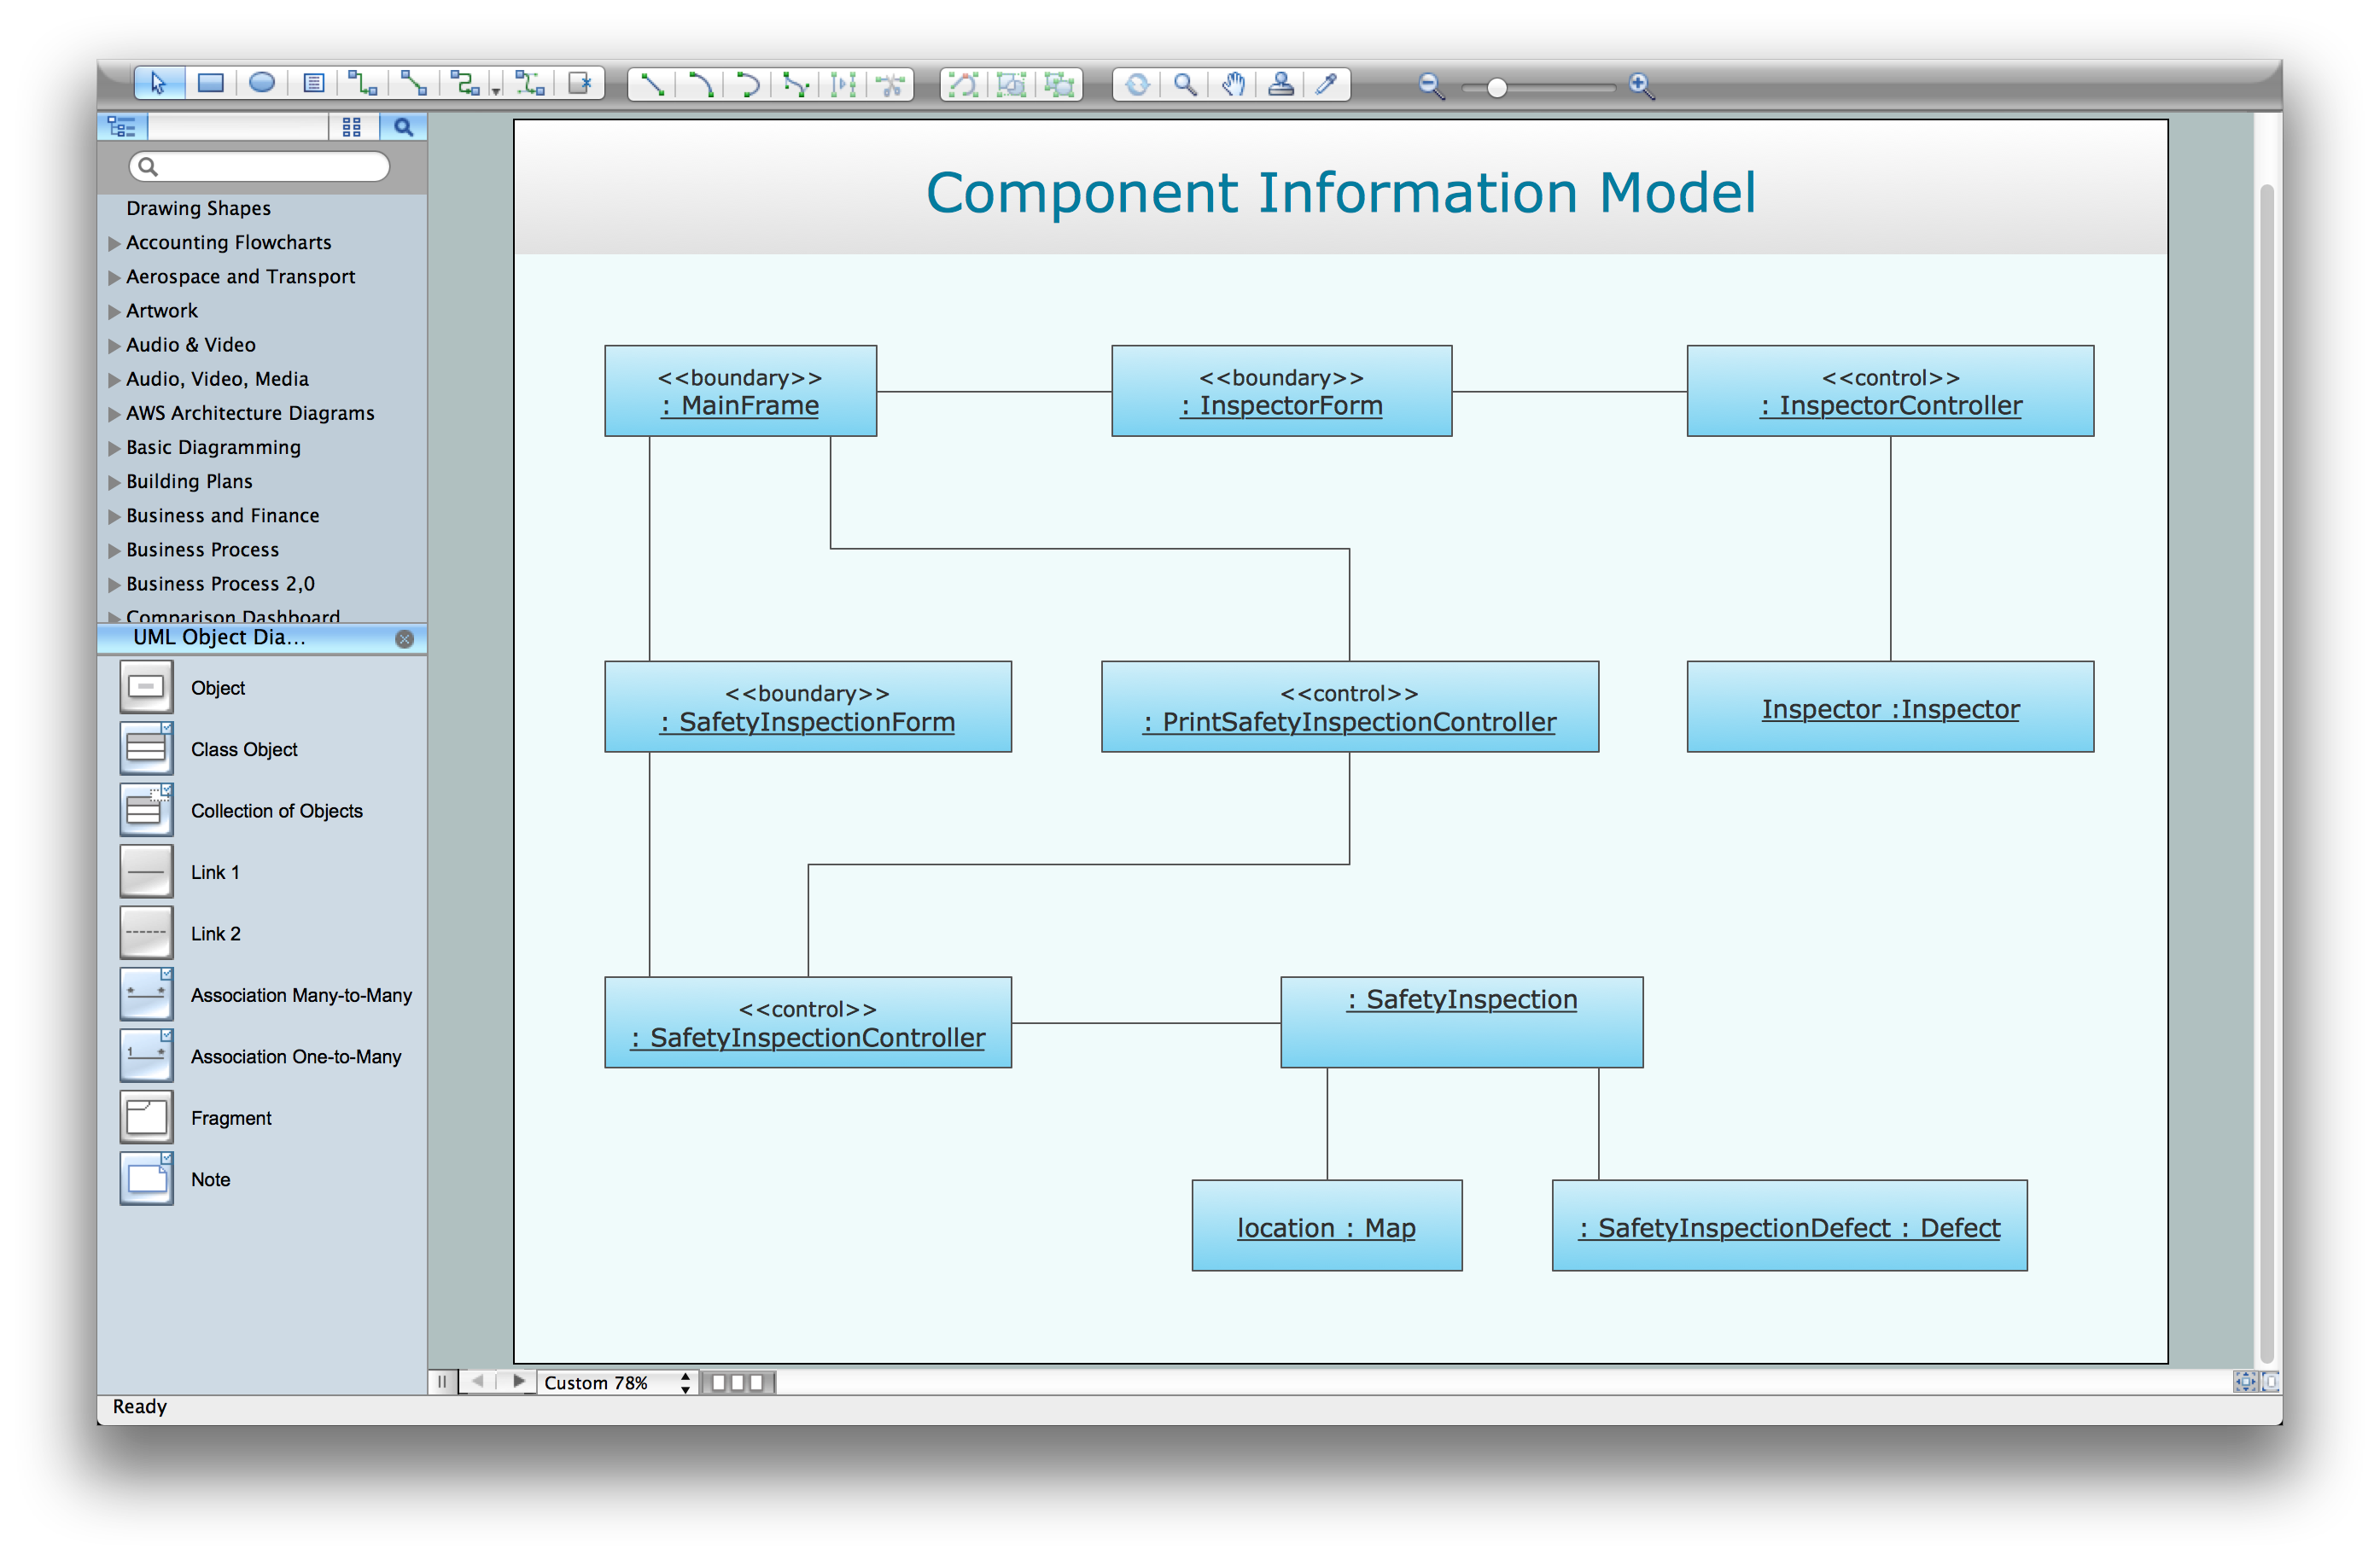
UML Software
Unified Modeling Language (UML) is a language of graphic description for object modeling in the field of software engineering. UML was created for definition, visualization, designing of software systems. UML is an open standard that uses graphic notations for creating visual models of object-oriented software systems. The Rapid UML Solution for ConceptDraw PRO presentsthe intuitive RapidDraw interface that helps you to make the UML Diagram of any of these 13 types quick and easy.Definition TQM Diagram
The Total Quality Management Diagram solution helps your organization visualize business and industrial processes. Create Total Quality Management diagrams for business process with ConceptDraw software.Diagramming Software for Design UML Use Case Diagrams
Use Case Diagrams describes the functionality provided by a system in terms of actors, their goals represented as use cases, and any dependencies among those use cases.
Formalization and Verification of Event-driven Process chain
EPC or The Event - driven Process Chain diagrams that provide Enterprise Resource Planning improvement. ConceptDraw PRO - software that reduces the time needed to create a business process model.How to Create a Bar Chart
The answer how to create a bar chart can be found in ConceptDraw software. The simple tips guide you through the software to quickly learn how to create a bar chart.Organizational Structure Total Quality Management
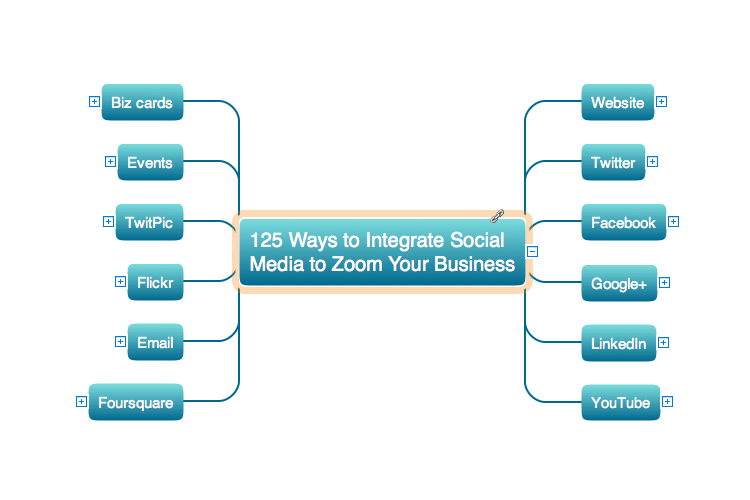
The Total Quality Management Diagram solution helps you and your organization visualize business and industrial processes. Create Total Quality Management diagrams for business process with ConceptDraw software.Quality Criteria MindMap
Quality Management Mind Maps - Presentations, Meeting Agendas, Problem will be solved. The visual form of mind maps is helpful in all stages of quality management, from describing problem to describing and documenting a decision.- Example Of A Diagram Design For Quality Management System In
- Qms System Diagram
- Business Process And Software Syststem Diagram
- Identifying Quality Management System | UML Diagram | Basic ...
- Block diagram - Document management system architecture | Block ...
- Quality Management System Block Diagram
- Identifying Quality Management System | Pyramid Diagram ...
- Identifying Quality Management System | Flow chart Example ...
- Block diagram - Document management system architecture | Block ...
- Document Management Workflow Diagram
- Documentation Procedures
- Online Training Process Diagram
- Software Documentation
- Process Flowchart | How to Draw EPC Diagram Quickly | Identifying ...
- Quality Management System | Interaction Overview Diagram ...
- Process Flowchart | Seven Basic Tools of Quality - Quality Control ...
- Process Flowchart | Fishbone Diagrams | Identifying Quality ...
- Example of DFD for Online Store (Data Flow Diagram ) DFD ...
- Process Flowchart | Quality Management System | How to Create ...


