 25 Typical Orgcharts
The 25 Typical Orgcharts solution contains powerful organizational structure and organizational management drawing tools, a variety of professionally designed organization chart and matrix organization structure samples, 25 templates based on various orga
Basic Flowchart Symbols and Meaning
Flowcharts are the best for visually representation the business processes and the flow of a custom-order process through various departments within an organization. ConceptDraw PRO diagramming and vector drawing software extended with Flowcharts solution offers the full set of predesigned basic flowchart symbols which are gathered at two libraries: Flowchart and Flowcharts Rapid Draw. Among them are: process, terminator, decision, data, document, display, manual loop, and many other specific symbols. The meaning for each symbol offered by ConceptDraw gives the presentation about their proposed use in professional Flowcharts for business and technical processes, software algorithms, well-developed structures of web sites, Workflow diagrams, Process flow diagram and correlation in developing on-line instructional projects or business process system. Use of ready flow chart symbols in diagrams is incredibly useful - you need simply drag desired from the libraries to your document and arrange them in required order. There are a few serious alternatives to Visio for Mac, one of them is ConceptDraw PRO. It is one of the main contender with the most similar features and capabilities.
Social Media Flowchart Symbols
Social media is a popular view of mass communication which allows people, companies and organizations create, share, discover, modify, access, comment, discuss and exchange information through the Internet. Social Media Response solution for ConceptDraw PRO provides collection of 10 libraries with diversity of predesigned vector social media flowchart symbols for fast and easy creating interactive Social Media Flowcharts, Response Charts and Action Mind Maps.
 Computer Network Diagrams
Computer Network Diagrams solution extends ConceptDraw PRO software with samples, templates and libraries of vector icons and objects of computer network devices and network components to help you create professional-looking Computer Network Diagrams, to plan simple home networks and complex computer network configurations for large buildings, to represent their schemes in a comprehensible graphical view, to document computer networks configurations, to depict the interactions between network's components, the used protocols and topologies, to represent physical and logical network structures, to compare visually different topologies and to depict their combinations, to represent in details the network structure with help of schemes, to study and analyze the network configurations, to communicate effectively to engineers, stakeholders and end-users, to track network working and troubleshoot, if necessary.
Word Exchange. Garnet
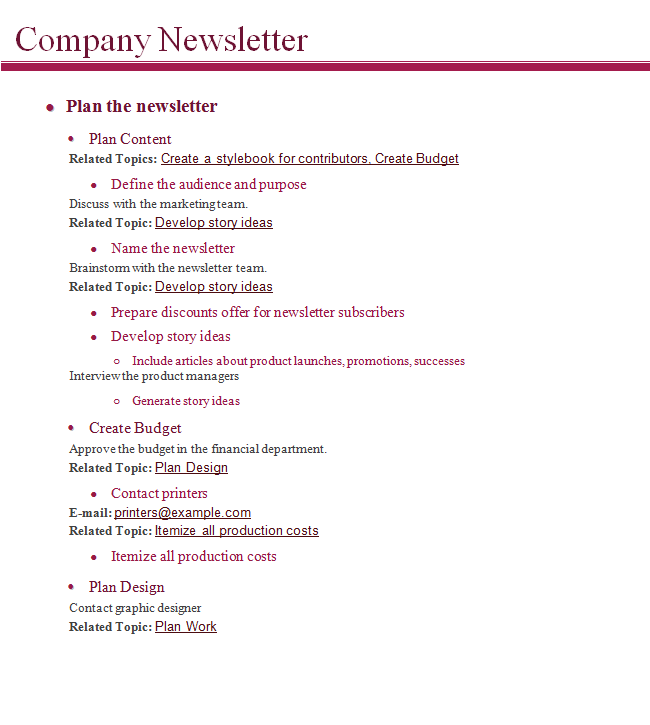
The possibility of exporting and collaboration with colleagues who work with another software applications, makes the ConceptDraw MINDMAP application powerful in resolution many kinds of tasks. The Business Productivity Solutions offered by ConceptDraw Solution Park, such as Presentation Exchange and Word Exchange enhance the scope of capabilities and increase the valuation of ConceptDraw MINDMAP software. They support managers, knowledge workers, businessmen, and many other people in making their jobs easier, they help to save them time and achieve the better results in shortest terms. ConceptDraw MINDMAP lets you design in minutes the framework for your future article or book, to fill the obtained structure with ideas, and then produce the MS Word document in one click of the mouse. And vice versa, you can upload your MS Word document into a Mind Map to present the structure and story, to review, refine and discuss with colleagues. The offered example visually illustrates the simple capability of word exchange in ConceptDraw MINDMAP.How to Draw EPC Diagram Quickly
An event-driven process chain diagram is a flowchart used in business process analysis. It evolved from Architecture of Integrated Information Systems (ARIS) and utilised in the business process improvement and analysis. It is also used to facilitate enterprise resource planning. An EPC diagram is a complex flowchart that shows different business processes through various workflows. The workflows are seen as functions and events that are connected by different teams or people, as well as tasks that allow business processes to be executed. ConceptDraw PRO is a software for making EPC diagrams that allows managers visually present business process models for making decisions for business.
Visio Files and ConceptDraw
Visio Files and ConceptDraw. ConceptDraw PRO is compatible with MS Visio .VDX formatted files.VDX is Visio’s open XML file format, and it can be easily imported and exported by ConceptDraw PRO.HelpDesk
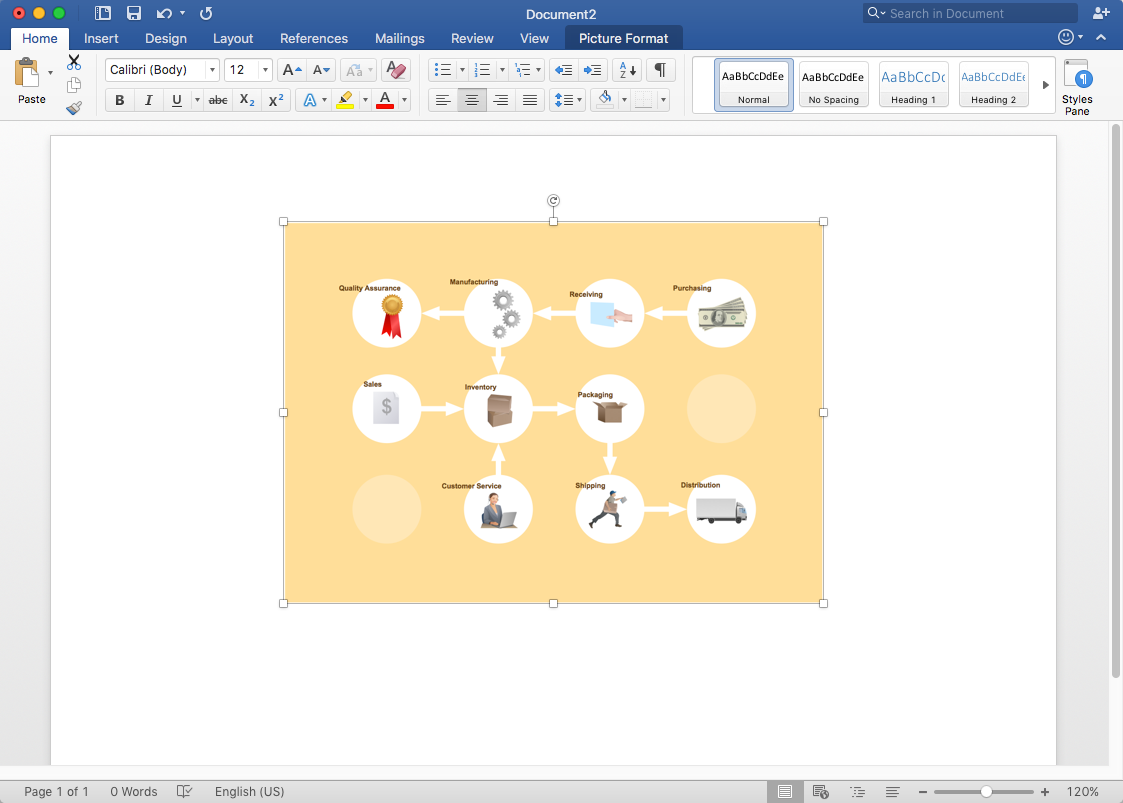
How to Add a Workflow Diagram to MS Word Document
ConceptDraw PRO allows you to easily create workflow diagrams and then paste them into a MS Word document.HelpDesk
How to Draw a Pyramid Diagram in ConceptDraw PRO
Pyramid diagram (triangle diagram) is used to represent data, which have hierarchy and basics. Due to the triangular form of diagram, each pyramid section has a different width. The width of the segment shows the level of its hierarchy. Typically, the top of the pyramid is the data that are more important than the base data. Pyramid scheme can be used to show proportional and hierarchical relationships between some logically related items, such as departments within an organization, or successive elements of any process. This type of diagram is often used in marketing to display hierarchical related data, but it can be used in a variety of situations. ConceptDraw PRO allows you to make a pyramid diagram, quickly and easily using special libraries.How To Create Onion Diagram
An onion diagram is a kind of chart that shows the dependencies among parts of an organization or process. The chart displays items in concentric circles, where the items in each ring depend on the items in the smaller rings. The Onion Diagram is able to show layers of a complete system in a few circles. But how to create Onion Diagram? Now, it's very easy thanks to the ConceptDraw PRO diagramming and vector drawing software extended with Stakeholder Onion Diagrams Solution from the Management Area of ConceptDraw Solution Park.- 25 Typical Orgcharts | Organisation Chart Template In Word
- Making An Org Chart In Word
- Word Organisation Chart Connector
- Word Hierarchical Chart
- Insert Powerpoint Org Chart Word
- Microsoft Word Hierarchy Chart Samples
- How To Add Boxes To An Organizational Chart In Word
- How to Draw an Organizational Chart Using ConceptDraw PRO ...
- How to Draw an Organization Chart | Marketing and Sales ...


