HelpDesk
Event-driven Process Chain (EPC) Diagram Software
An EPC diagram is a type of flowchart used in business process analysis. It shows different business processes through various work flows. The workflows are shown as processes and events that are related to different executes and tasks that allow business workflow to be completed. An EPC diagram shows different business processes through various workflows. The workflows are seen as functions and events that are connected by different teams or people, as well as tasks that allow business processes to be executed. The best thing about this type of enterprise modelling is that creating an EPC diagram is quick and simple as long as you have the proper tool. One of the main usages of the EPC diagrams is in the modelling, analyzing and re-engineering of business processes. With the use of the flowchart, businesses are able to see inefficiencies in the processes and modify to make them more productive. Event-driven process chain diagrams are also used to configure an enterprise resource plaHelpDesk
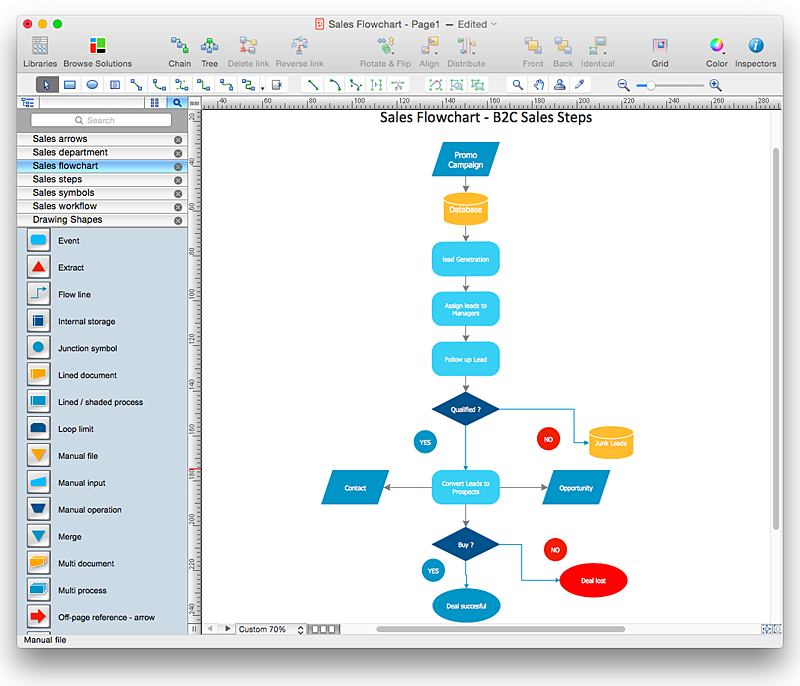
How to Create a Sales Flowchart Using ConceptDraw PRO
A Sales flowchart is a specialized type of flowchart. With the help of a sales flowchart you can visually describe tasks, documents, people responsible for execution at each stage of the sales process. For most commercial organizations, the sales process is inherent to its existence and ability to create profit. Although each company will achieve this aim in its own way, the core selling process remains similar throughout — a potential buyer or prospective customer exchanges money with an organization in return for goods or services. Despite this rather simplistic definition, there exists huge scope as to which approach is taken. Indeed, it is not uncommon for the sales division to be the largest within a corporate structure, employing a team of salespeople, analysts, and the sales managers, who are in charge of sales division operations.The practical applications of sales process flowcharts are numerous and wide ranging. At sales level, you might map the process of customer interactHow To Create Professional Diagrams
No need for any special drawing skills to create professional looking diagrams outside of your knowledge base. ConceptDraw PRO takes care of the technical side. Use templates, samples and special libraries for your needs.
 MindTweet
This solution extends ConceptDraw MINDMAP software with the ability to brainstorm, review and organize the sending of Tweets.
- How to Use the ″Online Store PR Campaign ″ Sample | How to ...
- Online Diagram Tool | How to Use the ″Online Store PR Campaign ...
- How to Use the ″Online Store PR Campaign ″ Sample | Flow chart ...
- How to Create a Social Media DFD Flowchart | Flow chart Example ...
- Marketing Campaign Management System Er Diagram
- Process Flowchart | How to Use the ″Online Store PR Campaign ...
- How to Use the ″Online Store PR Campaign ″ Sample ...
- How to Create a Social Media DFD Flowchart | How to Use the ...
- How to Use the ″Online Store PR Campaign ″ Sample | How to ...
- Basic Diagramming | Process Flowchart | Flow chart Example ...
- Flow chart Example. Warehouse Flowchart | How to Use the ...
- State Diagram Example - Online Store | How to Use the ″Online ...
- Process Flowchart | Venn diagram - Relationship marketing | Flow ...
- Flow chart Example. Warehouse Flowchart | SWOT Analysis ...
- How to Use the ″Online Store PR Campaign ″ Sample | How To ...
- Flowchart Example: Flow Chart of Marketing Analysis | Marketing ...
- Data Flow Diagram Software | Data Flow Diagram | How to Create a ...
- Competitor Analysis | How to Create a Cross Functional Flow Chart ...
- Online Marketing Objectives | How to Use the ″Online Store PR ...
- Flow chart Example. Warehouse Flowchart | Example of DFD for ...


