"In elementary algebra, a quadratic equation (from the Latin quadratus for "square") is any equation having the form
ax^2+bx+c=0
where x represents an unknown, and a, b, and c are constants with a not equal to 0. If a = 0, then the equation is linear, not quadratic. The constants a, b, and c are called, respectively, the quadratic coefficient, the linear coefficient and the constant or free term.
Because the quadratic equation involves only one unknown, it is called "univariate". The quadratic equation only contains powers of x that are non-negative integers, and therefore it is a polynomial equation, and in particular it is a second degree polynomial equation since the greatest power is two.
Quadratic equations can be solved by a process known in American English as factoring and in other varieties of English as factorising, by completing the square, by using the quadratic formula, or by graphing." [Quadratic equation. Wikipedia]
The flowchart example "Solving quadratic equation algorithm" was created using the ConceptDraw PRO diagramming and vector drawing software extended with the Mathematics solution from the Science and Education area of ConceptDraw Solution Park.
Diagram Flow Chart
ConceptDraw DIAGRAM is a software for producing flow charts.Technical Flow Chart
Flow chart is a diagrammatic representation of an algorithm and essential part of planning the system. Flow charts are widely used in technical analysis and programming for easy writing programs and explaining them to others. So, one of the most popular type of flow charts is Technical Flow Chart. Technical Flow Chart can be drawn by pencil on the paper, but it will be easier to use for designing a special software. ConceptDraw DIAGRAM diagramming and vector drawing software extended with Flowcharts Solution from the "Diagrams" Area of ConceptDraw Solution Park will be useful for this goal.Swim Lanes Flowchart. Flowchart Examples
This sample was created in ConceptDraw DIAGRAM diagramming and vector drawing software using the Cross-Functional Flowcharts solution from the Business Processes area of ConceptDraw Solution Park. This sample shows the Swim Lanes Flowchart of Identification and logging.
"In mathematics, the Euclidean algorithm, or Euclid's algorithm, is a method for computing the greatest common divisor (GCD) of two (usually positive) integers, also known as the greatest common factor (GCF) or highest common factor (HCF). ...
The GCD of two positive integers is the largest integer that divides both of them without leaving a remainder (the GCD of two integers in general is defined in a more subtle way).
In its simplest form, Euclid's algorithm starts with a pair of positive integers, and forms a new pair that consists of the smaller number and the difference between the larger and smaller numbers. The process repeats until the numbers in the pair are equal. That number then is the greatest common divisor of the original pair of integers.
The main principle is that the GCD does not change if the smaller number is subtracted from the larger number. ... Since the larger of the two numbers is reduced, repeating this process gives successively smaller numbers, so this repetition will necessarily stop sooner or later - when the numbers are equal (if the process is attempted once more, one of the numbers will become 0)." [Euclidean algorithm. Wikipedia]
The flowchart example "Euclidean algorithm" was created using the ConceptDraw PRO diagramming and vector drawing software extended with the Mathematics solution from the Science and Education area of ConceptDraw Solution Park.
 Flowcharts
The Flowcharts solution for ConceptDraw DIAGRAM is a comprehensive set of examples and samples in several varied color themes for professionals that need to represent graphically a process. Solution value is added by the basic flow chart template and shapes' libraries of flowchart notation. ConceptDraw DIAGRAM flow chart creator lets one depict the processes of any complexity and length, as well as design the Flowchart either vertically or horizontally.
Introduction to bookkeeping: Accounting flowchart process
Everything about Bookkeeping: Accounting flowchart process. Which symbols to use, how to make a chart.HelpDesk
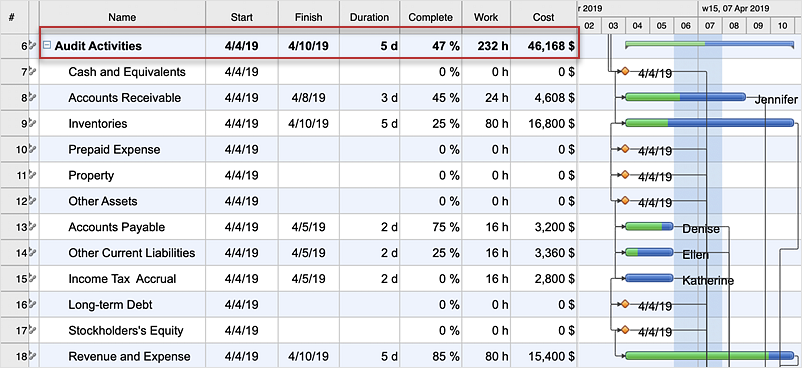
How are Summary Values of Project Phases Calculated
The project schedule usually consists of a list of project tasks joined into project phases. Each task has its own value such as duration, cost, % complete, etc.Flowchart Examples and Templates
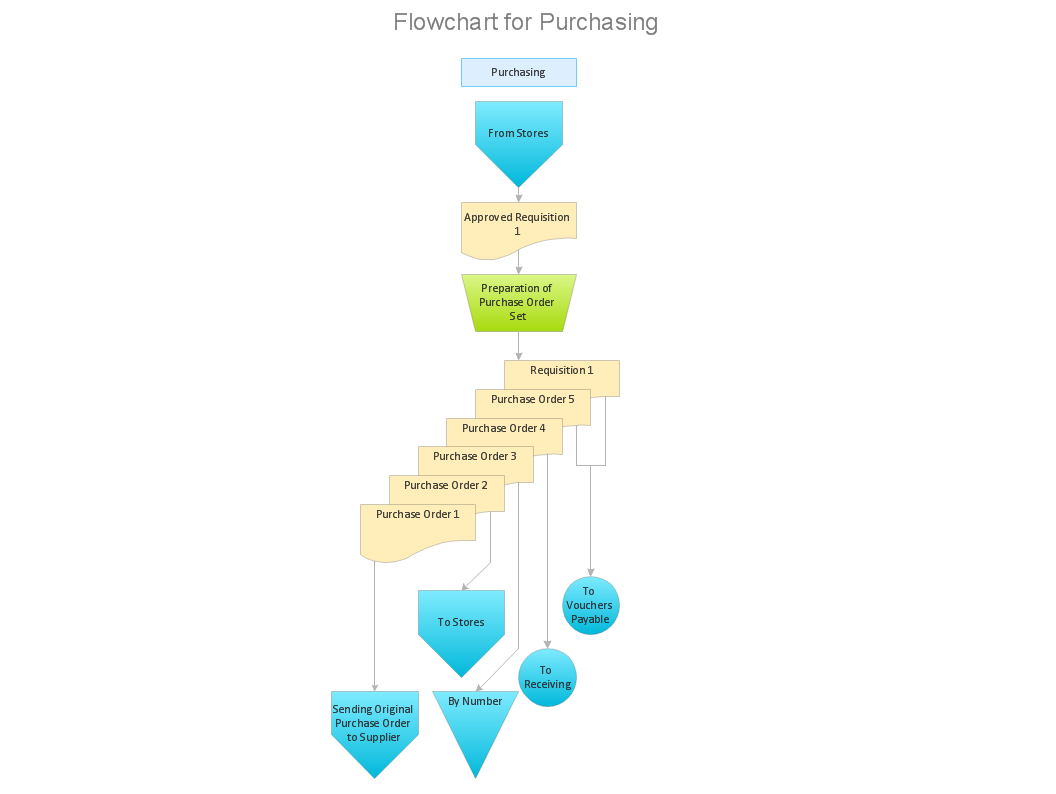
ConceptDraw DIAGRAM ector diagramming software and ConceptDraw Solution Park provide a wide variety of diagrams, organizational charts, business charts and flowchart examples, templates and samples. You are free to choose any example or template you are interested in from the ConceptDraw STORE, then use it to simplify your work at the designing professional-looking flowcharts and diagrams. As for flowcharts, turn your attention for the Flowcharts solution from the "Diagrams" area of ConceptDraw Solution Park, Process Flowcharts and Cross-Functional Flowcharts solutions from the Business Processes area, Accounting Flowcharts and Audit Flowcharts solutions from the Finance and Accounting area, which are completely devoted to flowcharts creation and provide an enormous collection of helpful flowchart templates and samples. Each of them is specially developed, well thought-out, dedicated to a certain thematic and carries a specific purpose. You need only to determine with your needs and to decide which one corresponds them the best and suits for you.Probability Quality Control Tools
The Total Quality Management Diagram solution helps your organization visualize business and industrial processes. Create Total Quality Management diagrams for business process with ConceptDraw software.HelpDesk
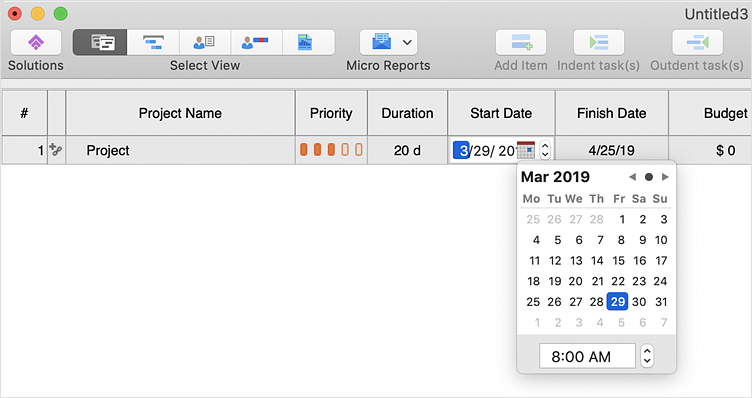
How to Operate with Project Time Frames in ConceptDraw PROJECT
ConceptDraw PROJECT applies an advanced scheduling facilities to enable you arrange your project's tasks with existing human and material resources. Comprehension of project scheduling principle allows you to plan the project the best way to execute it. Sometimes user is wondering why the task is moved to a different time than he supposed. Or he may be confused when a task's tardiness provoke the unwanted shift of other tasks. This article describes how do changes to the Start/Finish dates, or the Duration of the task affect the project schedule, created in ConceptDraw PROJECT.Troubleshooting in Wireless Connection
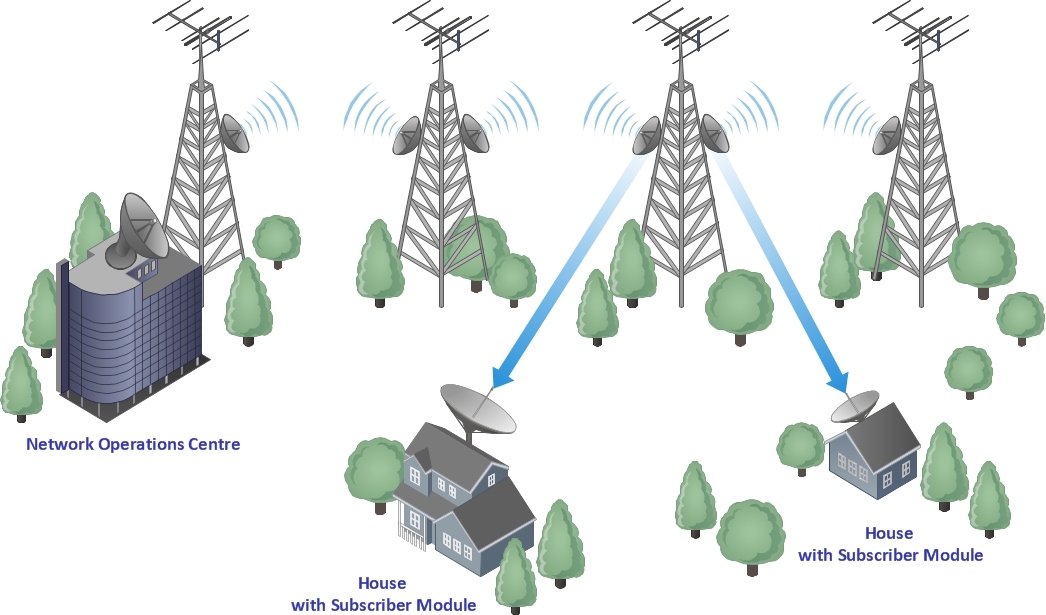
ConceptDraw Wireless network diagrams help you to clearly represent and communicate the architecture, topology, and design of your wireless networks to engineers, stakeholders and end-users.Illustrate the Computer Network of a Building
With best content of the Wireless Network solution that includes more than 10 building pre-designed objects network engineers can illustrate the computer network of a building.- Process Flowchart | Flow Chart Diagram Examples | Basic Flowchart ...
- Solving quadratic equation algorithm - Flowchart | Mathematical ...
- Solving quadratic equation algorithm - Flowchart | Pseudocode Of ...
- Solving quadratic equation algorithm - Flowchart | Basic Flowchart ...
- Solving quadratic equation algorithm - Flowchart | Mathematics ...
- Euclidean algorithm - Flowchart | Solving quadratic equation ...
- Basic Flowchart Symbols and Meaning | Simple Flow Chart | Types ...
- Method Of Calculating Of Flow Chart
- How to Discover Critical Path on a Gantt Chart | Process Flowchart ...
- Solving quadratic equation algorithm - Flowchart | Mathematics ...
- Process Flowchart | Sales Process Flowchart . Flowchart Examples ...
- Technical Flow Chart | Solving quadratic equation algorithm ...
- Euclidean algorithm - Flowchart | Draw A Flowchart To Calculate ...
- Solving quadratic equation algorithm - Flowchart | Draw A Flow ...
- Solving quadratic equation algorithm - Flowchart | The Building ...
- Solving quadratic equation algorithm - Flowchart | Euclidean ...
- Solving quadratic equation algorithm - Flowchart | Algorithm And ...
- Solving quadratic equation algorithm - Flowchart | Design A Flow ...
- Solving quadratic equation algorithm - Flowchart | Flow Chart ...
- Basic Flowchart Symbols and Meaning | Types of Flowcharts ...


