 Venn Diagrams
Venn Diagrams are actively used to illustrate simple set relationships in set theory and probability theory, logic and statistics, mathematics and computer science, linguistics, sociology, and marketing. Venn Diagrams are also often used to visually summarize the status and future viability of a project.
 Pie Charts
Pie Charts are extensively used in statistics and business for explaining data and work results, in mass media for comparison (i.e. to visualize the percentage for the parts of one total), and in many other fields. The Pie Charts solution for ConceptDraw PRO v10 offers powerful drawing tools, varied templates, samples, and a library of vector stencils for simple construction and design of Pie Charts, Donut Chart, and Pie Graph Worksheets.
Product Overview
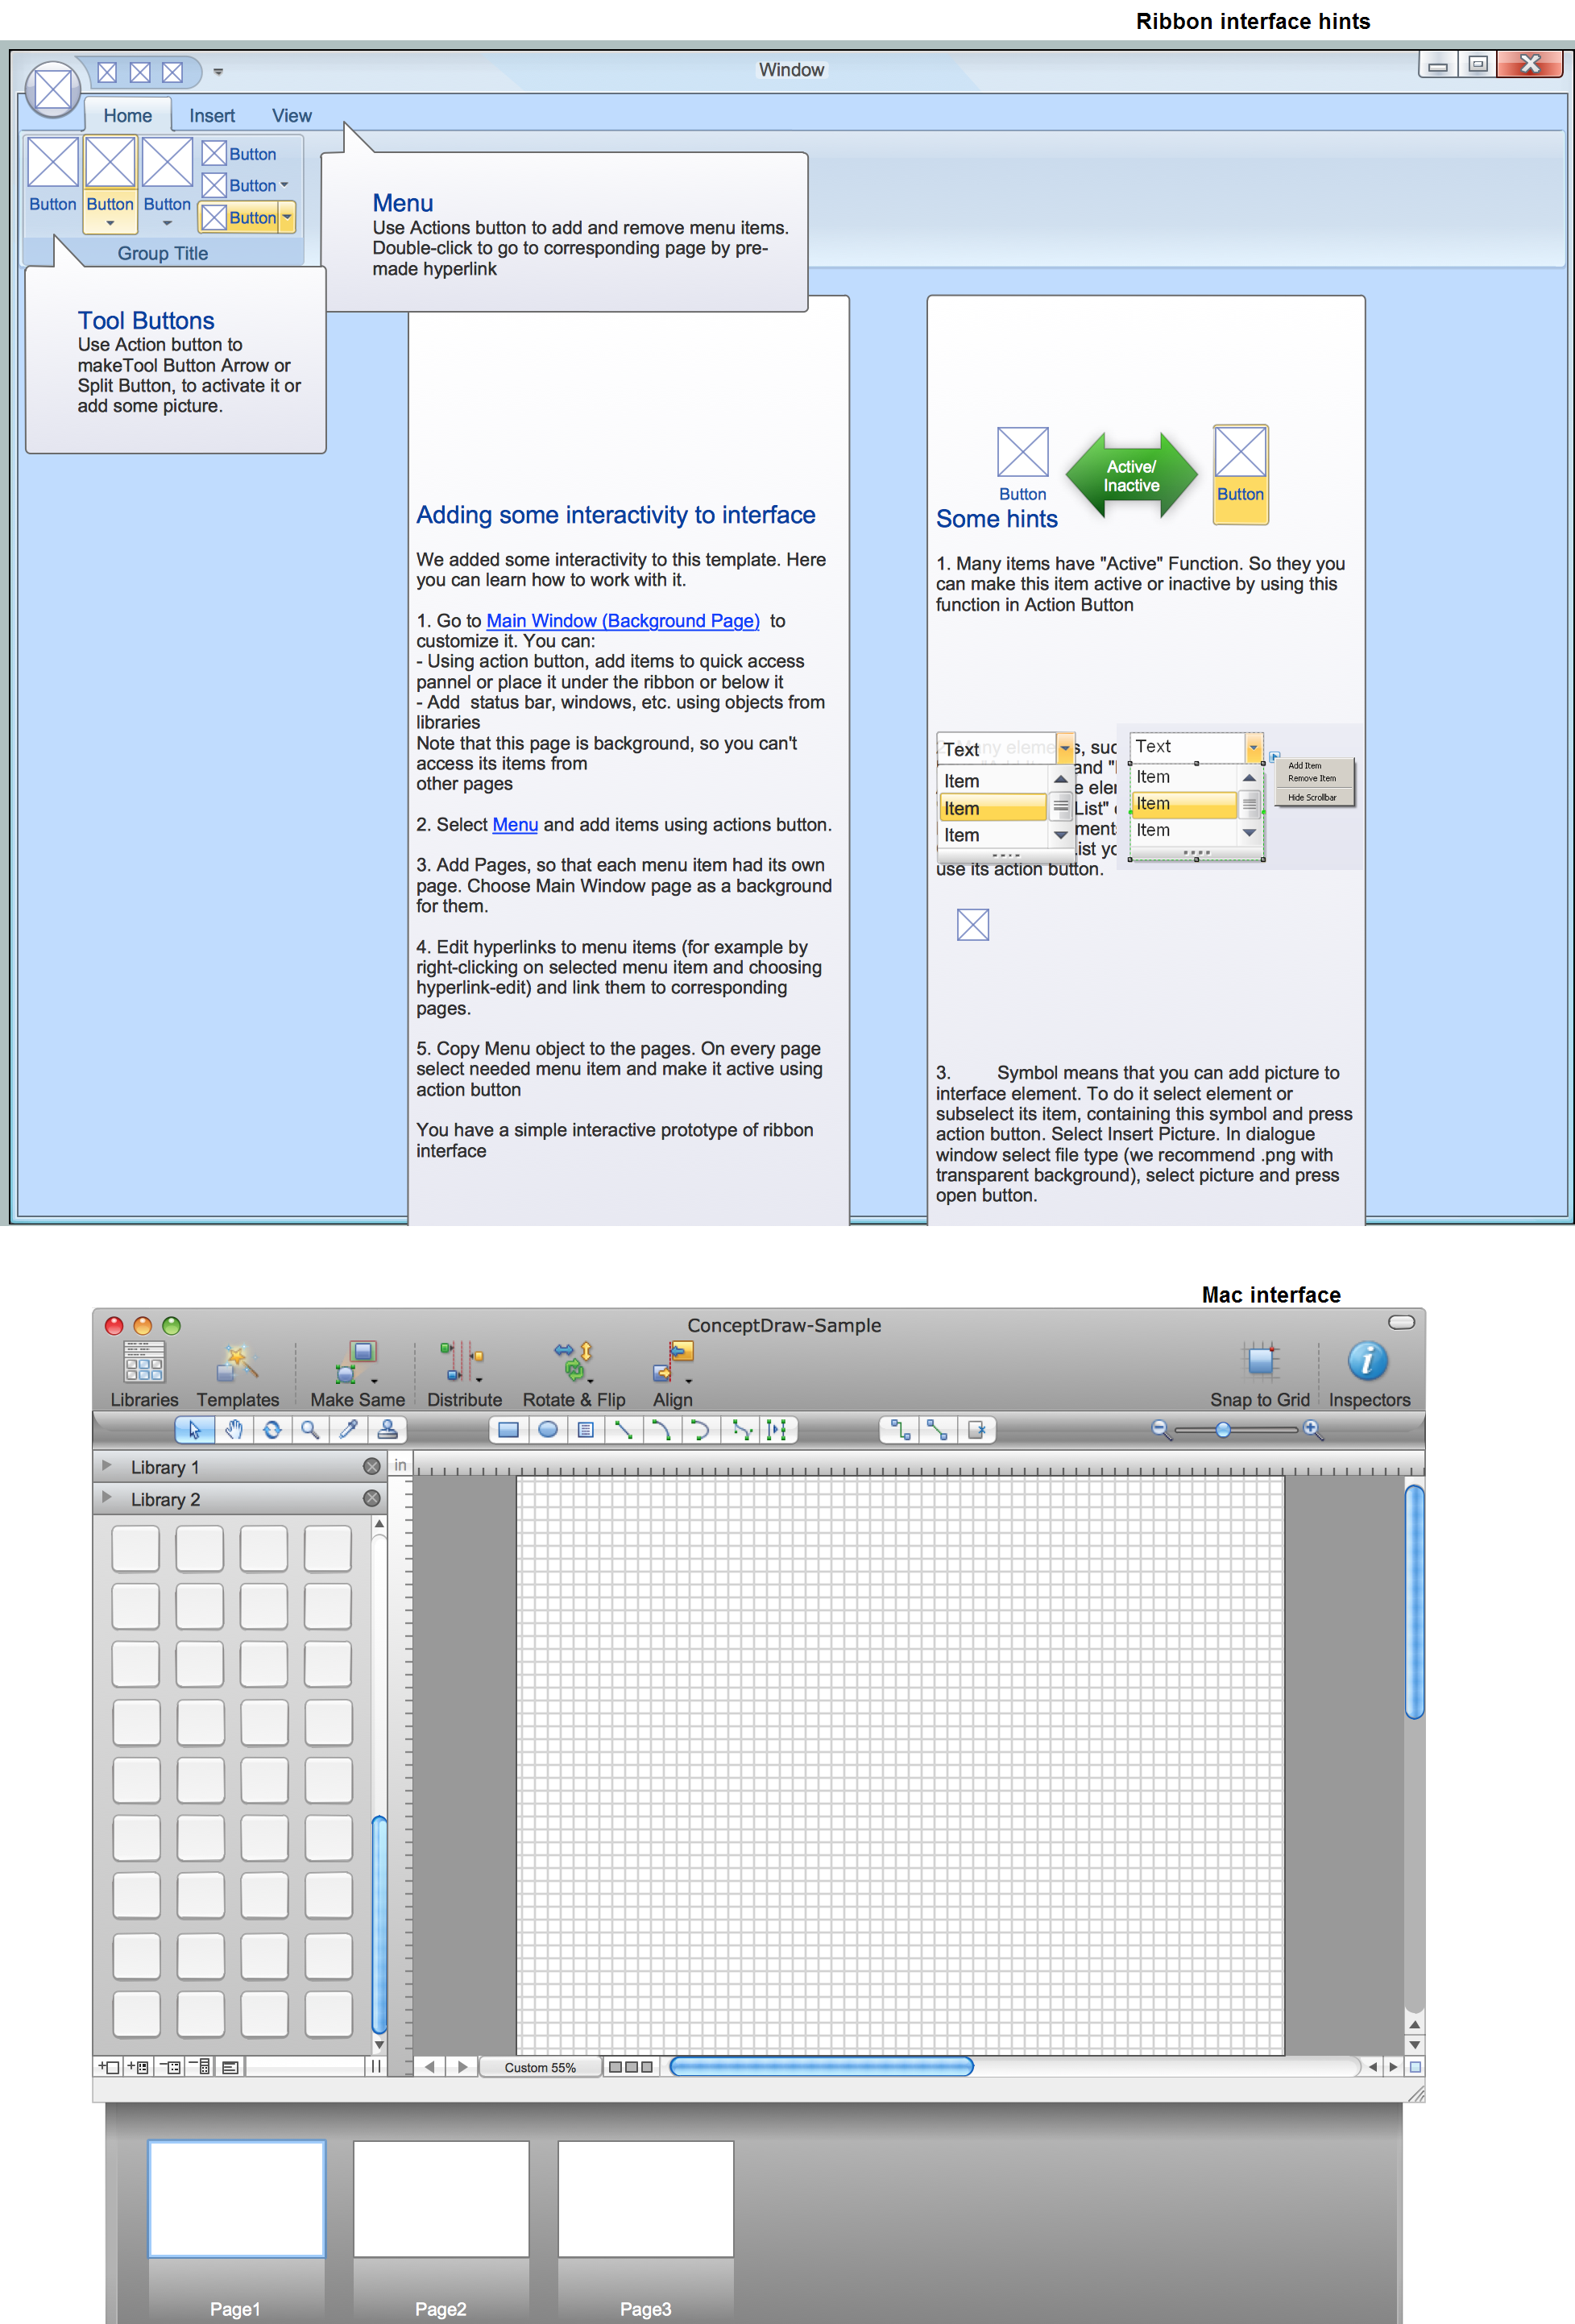
ConceptDraw PROJECT is a vigorous tool for managing single or multiple projects. It lets you determine all essential elements involved into project, control schedules, resources and finances, and monitor projects' progress in most effective yet simple manner.GUI Prototyping with ConceptDraw PRO
All about prototyping. GUI Prototyping with ConceptDraw. Download prototyping software.
 Management
This solution extends ConceptDraw PRO v9 and ConceptDraw MINDMAP v7 with Management Diagrams and Mind Maps (decision making, scheduling, thinking ideas, problem solving, business planning, company organizing, SWOT analysis, preparing and holding meetings
 Cross-Functional Flowcharts
Cross-functional flowcharts are powerful and useful tool for visualizing and analyzing complex business processes which requires involvement of multiple people, teams or even departments. They let clearly represent a sequence of the process steps, the order of operations, relationships between processes and responsible functional units (such as departments or positions).
 Interactive Voice Response Diagrams
Interactive Voice Response Diagrams solution extends ConceptDraw PRO v10 software with samples, templates and libraries of ready-to-use vector stencils that help create Interactive Voice Response (IVR) diagrams illustrating in details a work of interactive voice response system, the IVR system’s logical and physical structure, Voice-over-Internet Protocol (VoIP) diagrams, and Action VoIP diagrams with representing voice actions on them, to visualize how the computers interact with callers through voice recognition and dual-tone multi-frequency signaling (DTMF) keypad inputs.
- Flowchart Component | Column Chart Template | Flowchart ...
- Polar Graph | Bar Chart Software | Process Flowchart | Maths Graph ...
- How to Draw a Gantt Chart Using ConceptDraw PRO | How to Draw ...
- Business Report Pie. Pie Chart Examples | Bar Chart Examples ...
- Bar Chart Software | Polar Graph | Pie Chart Software | Free Graph ...
- Gant Chart in Project Management | How to Draw an Organization ...
- Pie Chart Software | How to Draw a Pie Chart Using ConceptDraw ...
- Chart Maker for Presentations | Bar Chart Software | Pie Chart ...
- Flowchart Component
- Divided Bar Diagrams | Divided bar diagram - Template | How to ...
- Draw A Chart On Components Of Environment
- Process Flowchart | Bar Chart Software | Classroom Seating Chart ...
- Pyramid Diagram | Pyramid Diagram | Process Flowchart | Chart Of ...
- Bar Chart Software | ConceptDraw PRO Network Diagram Tool ...
- Pie Charts | How to Draw the Different Types of Pie Charts | How to ...
- Process Flowchart | Entity-Relationship Diagram (ERD) with ...
- Content marketing cycle - Diamond pie chart | How to Draw a Pie ...
- Graph Making Free
- Process Flowchart | Pie Chart Examples and Templates | Basic ...
- Design elements - Education charts | How to Draw a Scatter ...

