This site uses cookies. By continuing to browse the ConceptDraw site you are agreeing to our Use of Site Cookies.

Create a Presentation Using a Design Template

The intuitive interface of ConceptDraw MINDMAP and the Functional Tools overview below will guide you in creating and demonstrating powerful mind map presentations using template. An advanced tool allows you effectively generate, change, and update your presentation.

How to Create a PowerPoint Presentation from a SWOT Analysis Mindmap

You can use SWOT analysis PowerPoint presentation to represent strengths, weakness, opportunities, and threats involved in your SWOT matrix.

Demonstrating Results

ConceptDraw MINDMAP software is an advanced tool for creating presentations. You can effectively generate, change, and update your presentation for demonstrating results of your work.

How to Make SWOT Analysis in a Word Document

A SWOT Analysis is a popular tool of the strategic planning which is used to evaluate the Strengths, Weaknesses, Opportunities, and Threats that are involved in any businesses. Use of mind maps allows you to collect a lot of information used for SWOT Analysis, visually structure it and also identify the relationships between different parts of this information. SWOT and TOWS Matrix Diagrams solution for ConceptDraw Solution Park combines professional visual advantages of ConceptDraw MINDMAP software and presentation capabilities of ConceptDraw DIAGRAM , which together provide a complete work solution. The SWOT and TOWS diagrams, matrices or mind maps produced in ConceptDraw DIAGRAM using the predesigned vector objects or filling the ready templates, can be then easily exported to Microsoft Word, Microsoft Visio, Microsoft PowerPoint, Adobe PDF, and many other electronic file formats. The possibility of export makes easy the use of SWOT diagrams designed in ConceptDraw DIAGRAM and lets you efficiently collaborate even with people who maybe don't have this software.

How To Do A Mind Map In PowerPoint

ConceptDraw MINDMAP - an excellent tool for exporting mind maps to PowerPoint to visualize and presenting your project. You can simply generate, change, update your mindmap and then make a presentation in PowerPoint.
HelpDesk

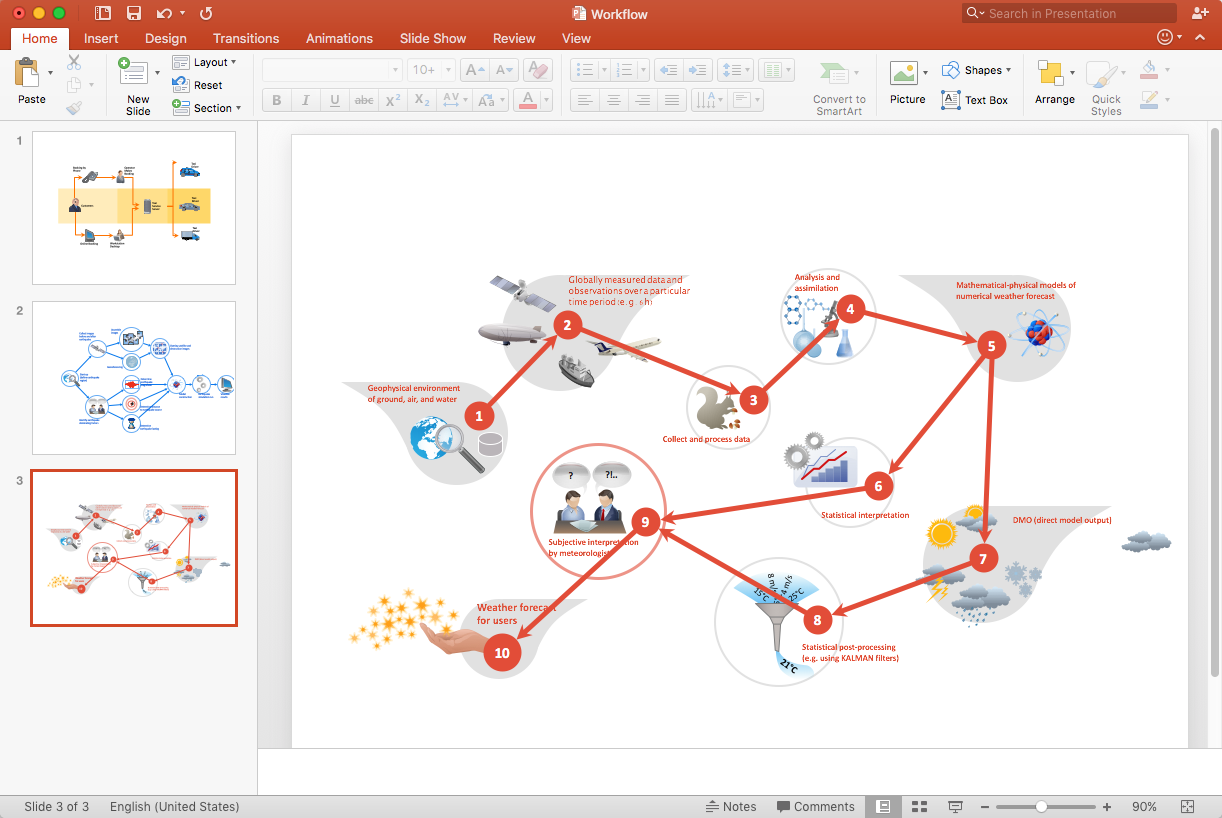
How to Add a Workflow Diagram to a PowerPoint Presentation

Making workflow diagrams in PowerPoint can help to describe the process within your organization as well as making comprehensive analysis presentations for sales or management and also can be used in other presentations and business documentation.

Scatter Graph Charting Software

ConceptDraw provides some interactive xy chart and scatter graph symbols that offers advanced features yet is simple to use.
HelpDesk

How to Add a Circle-spoke Diagram to PowerPoint

ConceptDraw DIAGRAM can be used as a tool for creating circle spoke diagrams along with other marketing diagrams. ConceptDraw DIAGRAM allows you to make a MS PowerPoint Presentation from your marketing diagrams in a few simple steps.
HelpDesk

How to Add a Bubble Diagram to PowerPoint Presentation

Bubble diagrams can be used to compare concepts, and identify areas of similarity and difference. ConceptDraw DIAGRAM allows you to make a MS PowerPoint Presentation from your charts in a few simple steps.
HelpDesk

How to Add a Block Diagram to a PowerPoint Presentation

A block diagram is a useful tool both in designing new processes, and in improving existing. A block diagram is a type of chart, which is often used in presentations, because of its universality - the graphic blocks can be applied to many processes.The PowerPoint presentation of major process steps and key process participants can be very informative and helpful. Using ConceptDraw DIAGRAM , you can easily convert a block diagram to MS PowerPoint presentation.
HelpDesk

How to Make PowerPoint Presentation of Data Driven Infographics

ConceptDraw DIAGRAM can be used as a tool for creating data-driven infographics. It allows you to draw data driven using the special templates and vector stencils libraries. ConceptDraw DIAGRAM allows you to make a MS PowerPoint Presentation from your Data-driven infographics in a few simple steps.
HelpDesk

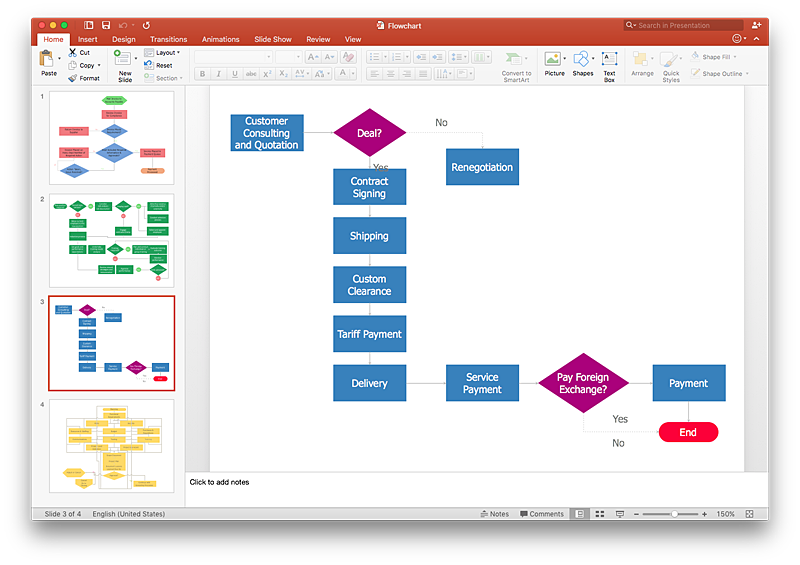
How To Make a PowerPoint Presentation of Flowcharts

ConceptDraw DIAGRAM allows you to create professional flowchart quickly and easily. The ability to create flowcharts is contained in the Flowcharts solution. To submit flowcharts for the audience, you can use export to MS PowerPoint.
HelpDesk

How To Make a PowerPoint Presentation of a Floor Plan

You can use ConceptDraw DIAGRAM to perform amazing PowerPoint presentation of the floor plan that includes the sizes, corners, squares, and other important technical and design details.
HelpDesk

How to Create SWOT Analysis Template

SWOT-analysis is used to develop a marketing strategy. SWOT-analysis includes determining the strengths and weaknesses of the company's activity, potential external threats, and opportunities and assesses their relative strategic competitors. ConceptDraw SWOT and TOWS Matrix Diagrams solution provides a set of SWOT matrix in which should be recorded and then compared the strengths and weaknesses of the enterprise and the market opportunities and threats. This comparison allows you to determine what steps can be taken for the development of your company and what problems need to be addressed urgently.
HelpDesk

How to Make an Ansoff Matrix Template

Ansoff Matrix is a business strategic management tool that helps a business determine its product and market growth strategy. Ansoff matrix has four sections to show each impacting ways that businesses can grow. Using Ansoff Matrix enables determining the current position of any business in the industry and choose the direction of its growth, which would provide the most competitive position. While Ansoff Matrix is most commonly used as a business planning tool it can be used also for personal development. You can make Ansoff Matrix template for your organization using ConceptDraw DIAGRAM Matrices solution.