HelpDesk
How to Create a Timeline Diagram in ConceptDraw PRO
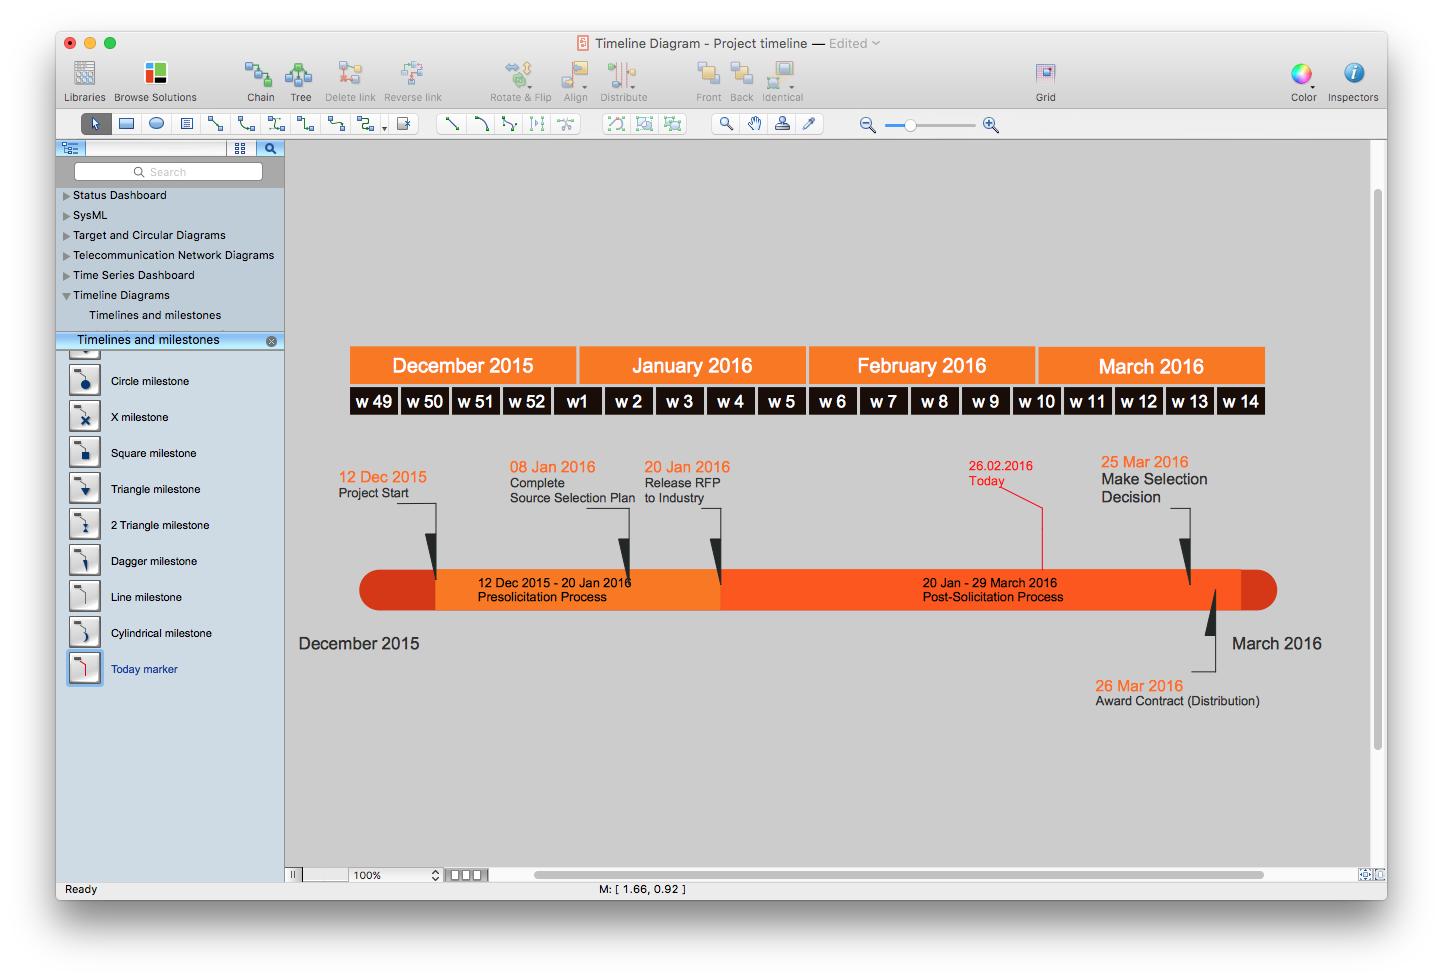
A Timeline is a chart which displays a project plan schedule in chronological order. A Timeline is used in project management to depict project milestones and visualize project phases, and show project progress. The graphic form of a timeline makes it easy to understand critical project milestones, such as the progress of a project schedule. Timelines are particularly useful for project scheduling or project management when accompanied with a Gantt chart. It captures the main of what the project will accomplish and how it will be done. making a project timeline is one of the most important skills a project manager needs have. Making comprehensive, accurate timelines allows you getting every project off in the best way. ConceptDraw PRO allows you to draw a timeline charts using special library.Timeline Examples
ConceptDraw PRO diagramming and vector drawing software offers the Timeline Diagrams solution from the Management area which is rich for the timeline examples, samples, templates and ready-to-use vector shapes.
 Timeline Diagrams
Timeline Diagrams solution extends ConceptDraw PRO software with templates, samples and library of vector stencils for drawing the timeline and milestones diagrams.
How to Make a Timeline
Timeline is a type of diagram which illustrates the series of events in a chronological order on a linear timescale. How to make a timeline? It is convenient to use a modern powerful software. ConceptDraw PRO diagramming and vector drawing software extended with Timeline Diagrams solution from the Management area is exactly what you need.Timeline Diagrams
Timeline is a powerful tool for project management and project scheduling, it is a convenient way to represent a chronological sequence of events and critical milestones along a time axis. Timeline allows quickly understand the temporal relationships and to see the progress of a project schedule.ConceptDraw PRO extended with Timeline Diagrams solution from the Management area of ConceptDraw Solution Park is a powerful software for fast and easy drawing useful and great-looking timeline diagrams.
HelpDesk
How to Create Project Diagrams on PC
Visual diagrams gives the ability to view at a detailed level project attributes such as project scope, logical connections in the project, critical paths, key events on the timeline, milestones, tasks, calendars for work, and resource utilization.Project Timeline
Project timeline is a type of chart which allows visually represent the chronology of works for the project, placing the key points of the project (milestones) on a timescale.You need to make professional looking project timeline? Create it with ConceptDraw PRO! ConceptDraw PRO extended with Timeline Diagrams Solution from the Management Area is the best timeline diagrams software
 Event-driven Process Chain (EPC) Diagrams
Event-driven Process Chain (EPC) Diagram is a type of flowchart widely used for modeling in business engineering and reengineering, business process improvement, and analysis. EPC method was developed within the Architecture of Integrated Information Systems (ARIS) framework.
HelpDesk
How to Create a Fishbone (Ishikawa) Diagram Quickly
A Fishbone (Ishikawa) diagram is also called cause-and-effect diagram. Fishbone diagram is often used in business to determine the cause of some problem. The diagram illustrates the main causes and sub-causes leading to an event. The main goal of the Fishbone diagram is to illustrate in a graphical way the relationship between a given outcome and all the factors that influence this outcome. The complete diagram resembles a fish skeleton as its name implies. The ability to create a Fishbone Diagram is supported by the Fishbone Diagram solution. Use ConceptDraw MINDMAP for structuring data and then ConceptDraw PRO for generating a Fishbone Diagram from mind map structure.
 Management Area
The solutions from Management area of ConceptDraw Solution Park collect templates, samples and libraries of vector stencils for drawing the management diagrams and mind maps.
 ConceptDraw Solution Park
ConceptDraw Solution Park collects graphic extensions, examples and learning materials
Competitor Analysis
Competitor analysis is a first and obligatory step in elaboration the proper corporate marketing strategy and creating sustainable competitive advantage. Use powerful opportunities of numerous solutions from ConceptDraw Solution Park for designing illustrative diagrams, charts, matrices which are necessary for effective competitor analysis.- Create An Events Planning Flow Chart
- How to Create a Timeline Diagram in ConceptDraw PRO | Project ...
- Timeline Diagrams | How to Create a Timeline Diagram in ...
- How to Create a Timeline Diagram in ConceptDraw PRO | How to ...
- How to Create a Timeline Diagram in ConceptDraw PRO | Timeline ...
- Timeline diagram | How to Create a Timeline Diagram in ...
- How to Create a Timeline Diagram in ConceptDraw PRO | Timeline ...
- Project Timeline | Timeline Diagrams | Timeline Examples | Project ...
- Timeline Diagrams | How to Create a Timeline Diagram in ...
- Timeline Examples | How to Create a Timeline Diagram in ...
- How to Make a Timeline | How to Create a Timeline Diagram in ...
- Entity Relationship Diagram Symbols and Meaning ERD Symbols ...
- Timeline Diagrams | Project timeline diagram - New business project ...
- How to Create a Timeline Diagram in ConceptDraw PRO | Project ...
- How to Create a Timeline Diagram in ConceptDraw PRO | Concept ...
- How to Create a BPMN Diagram Using Border Events in ...
- How to Create a Timeline Diagram in ConceptDraw PRO | Project ...
- How to Make a Timeline | Timeline Diagrams | Project Timeline ...
- How to Create a Timeline Diagram in ConceptDraw PRO | Examples ...
- Business Processes | How to Create a Timeline Diagram in ...


