This site uses cookies. By continuing to browse the ConceptDraw site you are agreeing to our Use of Site Cookies.
HelpDesk

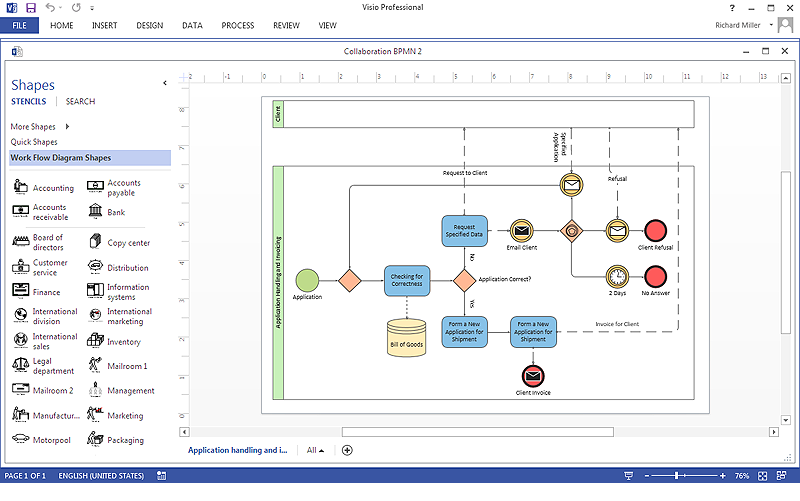
How To Create a MS Visio Business Process Diagram

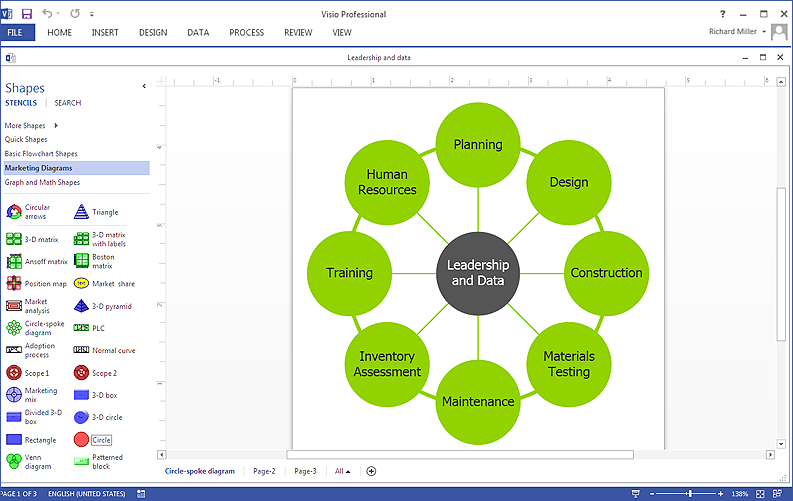
Business process diagrams are specialized types of flowcharts based on the Business Process Model and Notation. The BPMN specification describes the symbols to display business processes in the form of business process diagrams. The main objective of BPMN is to create a standard set of symbols that are understandable to all business users, such as business analysts who create and improve processes, technical developers responsible for implementing processes and managers who take care processes and control them. Making a business process diagram involves many different elements that can be managed using ConceptDraw DIAGRAM. The ability to design Business process diagrams is delivered by the Business Process Diagrams solution. ConceptDraw DIAGRAM supports export of business process diagrams to MS Visio files. Thus, you can share your business documentation with MS Visio users.
HelpDesk

How To Create MS Visio Cross-Functional Flowchart

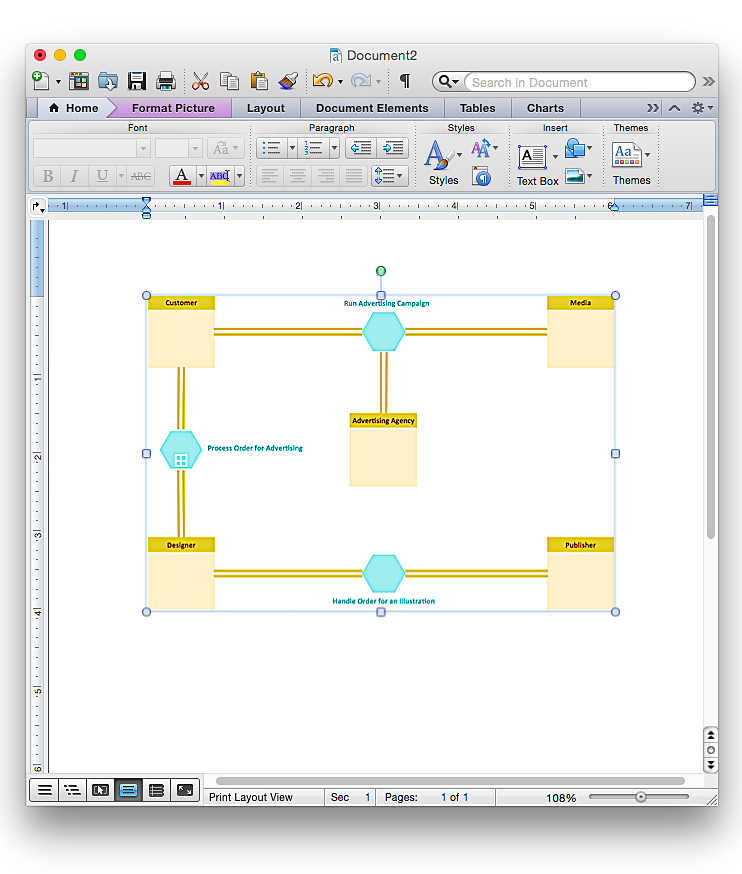
Cross-functional is a process involving several functional layers. Such processes typically cause the most problems, and therefore, is the most potential for improvement. Cross-functional business processes usually illustrate the processes of product development, commercial proposal development, the order execution process - everything, that involves several departments. The package of possible improvements - is the task of re-engineering. To illustrate the cross-functional processes often use cross-functional flowchart is often used to illustrate the cross-functional processes. ConceptDraw DIAGRAM allows you to easily create a cross-functional flowchart. Then, you can export it to MS Visio VSDX or VDX format and successfully share it with your colleagues still using MS Visio.
HelpDesk

How To Create a Workflow Diagram in Visio

A workflow diagram shows a working process as a set of related events that follow each other in a particular order. They are usually created as flowcharts, with shapes that represent steps in the process connected by arrows that indicate the next step. Making a business process diagram involves many elements that can be managed using ConceptDraw DIAGRAM. The ability to design workflow diagrams is delivered by the Workflow Diagrams solution. ConceptDraw DIAGRAM allows you to easily create workflow diagrams and then make an MS Visio file from your diagrams. Using ConceptDraw DIAGRAM, you can export your workflow diagrams to MS Visio VSDX and VDX files.
HelpDesk

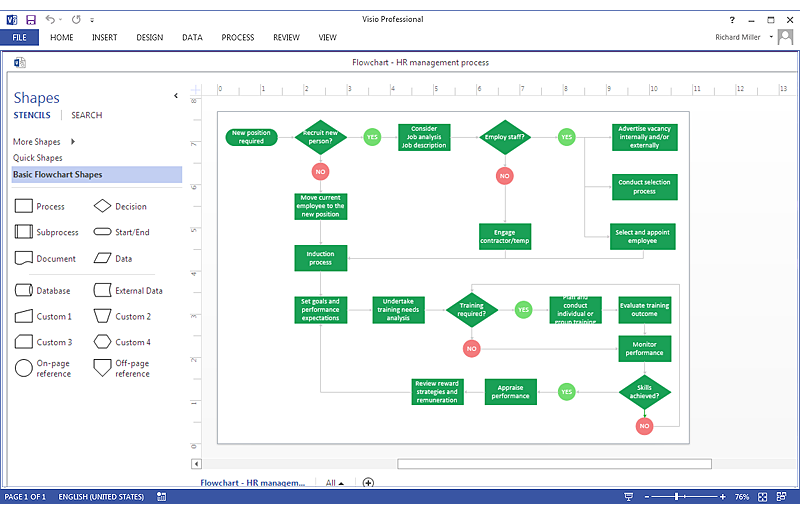
How To Create MS Visio Flowchart

Making a process or work flow step-by-step visualization helps you to better understand it and effectively communicate with your audience. Flowcharting is the best way to do this. Flowchart is a diagram that successively depicts all process steps. Basic flowchart is the most easy and understandable type of a flowchart. Using ConceptDraw DIAGRAM you can design flowcharts of any complexity on Windows or OS X. Then you can export them to Visio format to share with the users of MS Visio. Moreover, using ConceptDraw DIAGRAM you can open and edit a flowchart made in Visio, regardless of whether you are using OS X or Windows.

Business Process Reengineering. Business Process Example

This sample shows the Business Process Reengineering Diagram, displays the Continuous Improvement Process (CIP) directed at the permanent improvement of the processes. This sample can be used in business process management, quality management, project management and program management.
HelpDesk

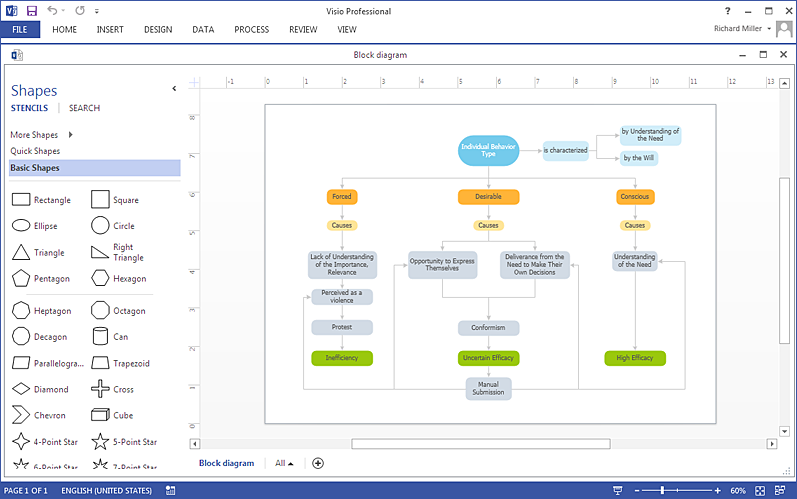
How To Create an MS Visio Block Diagram

ConceptDraw DIAGRAM allows you to easily create block diagrams of any complexity and then make an MS Visio file from your diagram in a single click.

cross-functional flowchart template, flowchart, example business process flow Cross-Functional Flowcharts

cross-functional flowchart template, flowchart, example business process flow
The Cross-Functional Flowcharts solution extends ConceptDraw DIAGRAM software with cross functional flowchart examples, samples, and libraries of cross functional flow chart vector design elements and CH-1 symbols for easy drawing professional-looking and illustrative Cross Functional Flowchart, Cross Functional Diagram, CH-1 Diagram, Process Flowchart, Deployment Flowchart, Opportunity Flowchart, Swimlane Process Mapping Diagram, or Visio Cross Functional Flowchart for planning and further analyzing, optimizing and improvement processes. The use of included pre-made cross functional flowchart template, opportunity flowchart template, and swimlane process map template, greatly easier designing your Cross-functional flowcharts.

ConceptDraw DIAGRAM The best Business Drawing Software

ConceptDraw DIAGRAM is new software for business and technical drawing. Powerful business drawing tools, extensive libraries with pre-drawn shapes, free samples of business drawings, technical drawings and flowcharts, support of many graphic formats enable users to visually develop their business drawings charts and diagrams in any combination of drawings, diagrams and flow charts.
HelpDesk

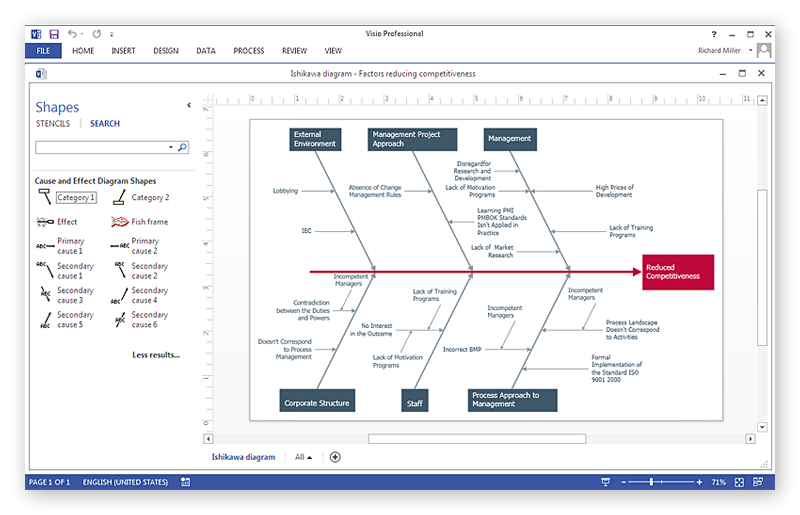
How To Create Cause and Effect (Fishbone) Diagram in MS Visio

Cause-and-Effect Ishikawa Diagram is a graphical method of analysis and cause-effect relationships, a tool in the form of fish bone. It is used to systematically determine the cause of the problem and represent it graphically. The technique is primarily used in the framework of quality management for the analysis of quality problems and their causes. Nowadays, it has found worldwide distribution and is used in multiple problem areas. It is one of the tools of lean manufacturing, which is used in group work to find the problems and their causes. ConceptDraw DIAGRAM allows you to easily create Fishbone (Ishikawa) diagram and then make a MS Visio VSDX, or VSD files from your diagrams in a couple clicks, using the export capabilities of ConcewptDraw DIAGRAM.

Program to Make Flow Chart

Use ConceptDraw DIAGRAM diagramming and business graphics software for drawing your own PM life cycle flow charts.

Business Process Modeling Software for Mac

ConceptDraw DIAGRAM - business process modeling software for mac offers the Business Process Diagram Solution with powerful tools to help you easy represent the business processes and create the business process diagrams based on BPMN 1.2 and BPMN 2.0 standards that allows to create of both simple and complex (nested) models of processes.

Export from ConceptDraw DIAGRAM Document to MS Visio® XML

Once you have created your document in ConceptDraw DIAGRAM and you want to share it with your colleagues and friends, who uses MS Visio on their computers, you can easily export your document using ConceptDraw DIAGRAM export to Visio XML files (VDX) feature. Now you can share your ConceptDraw documents with MS Visio users.
Export to MS Visio® XML

Business Process Flow Diagram

Business Process Flow Diagram is a graphical presentation of business processes and process flows. It is one of the main tool of business analysis and business process re-engineering that lets identify and easy understand process flows within organization. ConceptDraw DIAGRAM extended with Business Process Workflow Diagrams solution from the Business Processes area of ConceptDraw Solution Park is a powerful software which lets easy design Business Process Flow Diagram of any complexity.

Example Process Flow

A flowchart is a picture of the separate steps of a process in sequential order. ConceptDraw DIAGRAM is a Process Flowcharts software. This software includes basic package of process flow examples. The software contains object libraries with vector stencils that allows you use RapidDraw technology. By clicking on direction arrows you can add a new object to the flowchart.

How to Simplify Flow Charting — Cross-functional Flowchart

In ConceptDraw DIAGRAM it really is sp simple to draw even the most complex cross-functional flowcharts. Use the RapidDraw technology and Cross-Functional libraries in ConceptDraw DIAGRAM for the best results.

Basic Workflow Examples

ConceptDraw DIAGRAM with the Workflow Diagrams solution delivers a complete set of samples and templates. This set contains basic workflow examples you may use to start drawing your own workflow or to get closer with workflow idea.

How to Make a Timeline

Timeline is a type of diagram which illustrates the series of events in a chronological order on a linear timescale. How to make a timeline? It is convenient to use a modern powerful software. ConceptDraw DIAGRAM diagramming and vector drawing software extended with Timeline Diagrams solution from the Management area is exactly what you need.

Sample Project Flowchart. Flowchart Examples

This sample shows the Flowchart that displays the architecture of SQL Exception Translation. This sample was created in ConceptDraw DIAGRAM diagramming and vector drawing software using the Flowcharts solution from the Diagrams area of ConceptDraw Solution Park.
How to Simplify FlowCharting