This site uses cookies. By continuing to browse the ConceptDraw site you are agreeing to our Use of Site Cookies.

Creating a Family Tree

Enjoy the process of drawing a Family tree with ConceptDraw DIAGRAM enhanced with Family Tree solution. Specially developed templates and vector design elements included in Family Tree solution can save your time and effort. Show the entire picture of how your family looked like in past generations, the results of your discoveries related to your family and historical events. Perpetuate the names of your ancestors, honor their heritage, preserve the knowledge, and keep alive familial traditions and stories in a simple and visual way. Expand your tree as you obtain new data, add photos and images, notes with important dates, arrange your tree, change the color style, save for future generations, and share with your relatives in one click directly from the application. Get your children involved and tell them about the importance of preserving family history so they can continue it in the future.

Family Tree

A family tree, genealogy chart, or pedigree chart is a visual representation of a person’s lineage. It depicts the family relationships in a tree structure with one individual as the root. A family tree allows tracing common ancestors, overseeing the lineage of each individual family member by tracing the branches leading from him to the root. Start discovering your family story with ConceptDraw DIAGRAM and its Genogram solution, and you will make a professionally-looking family tree or family genogram in minutes. When your diagram is ready, you can share it with your family, friends, or some other people directly from the application.

Genealogy

Genealogy is the study of families, origins, and history of a particular family, the tracing of kinship and lineage, the past and present family members. It is accepted to depict the family genealogy in a form of a genealogy tree or pedigree chart. The ConceptDraw DIAGRAM software and Genogram solution included to the ConceptDraw Solution Park are the best for easy designing the Genograms of any complexity to present the genealogy, family kinship in a visual view.

family tree, genealogy, genogram Genogram

family tree, genealogy, genogram
Genogram solution including professionally designed genogram samples and a wide range of high-quality vector design elements of genogram symbols, medical genogram symbols, emotional relationships and family relationships, makes the ConceptDraw DIAGRAM software the best for drawing the informative Genograms, genealogy schematics and illustrations, and family tree of any depth, and for any quantity of generations. It perfectly suits for the medical specialists of different profiles, medical consultants, therapists, genetics, psychologists, and other medical professionals, each individual and couple.

Family Genogram Example

Each family genogram example, sample, and template included in the Genogram solution for ConceptDraw DIAGRAM is useful to be filled with your own data. Use included vector design elements to visualize efficiently your personal family relationships and history. Record names, dates of significant life events, gender, lifespan, medical information about serious diseases of ancestors, and other information. These data make your family tree useful for medical staff to trace possible diseases within the family history and prevent them or reduce their impact as much as possible for current and future generations. Use colors to identify specific family groups within your genogram or indicate the emotional relationships between the family members. Keep track of changes over time and make corrections, if you discover new circumstances.

Orgchart

Workforce planning is strategically important for each company, organization, enterprise, and corporation, non important it is business, commercial, non-profit or government organization. Organizational Chart or Orgchart is a type of diagram that is successfully used to graphically illustrate the structure of an organization and also relationships between its parts. There are three different types of Orgcharts: hierarchical, matrix and flat. ConceptDraw DIAGRAM diagramming and vector drawing software supplied with Organizational Charts Solution from Management Area is the best for easy designing professional-looking Orgcharts. This solution provides you the predesigned samples and Organizational Chart library with ready-to-use vector objects required for Orgchart design. It also offers the most simple way of drawing - the possibility to start with one of built-in Orgchart templates. Typically Orgcharts require for regular updating and making modifications, in ConceptDraw DIAGRAM it is fast and easy, the blocks are editable and remain connected when they are moved.

Family History

Family Tree solution for ConceptDraw DIAGRAM software saves your time offering intuitive design tools, large collection of vector design elements, samples, and templates. It is convenient for both designers and beginners due to its simplicity of use. You are free to choose: start from scratch or select a blank template from the Family Tree solution and customize it with shapes from the solution libraries. Most family trees usually outline from three to four generations. Show family history; make your family tree precise, simple, and easy to understand. Add clear labels, indicate coefficients of relatedness, and any other important parameters, group generations using the color-coordinate shapes and lines, and show direct and indirect family relationships.

Genome Sequencing

The genome sequencing or whole-genome sequencing is the process of determining the complete DNA sequence of an organism's genome, including both chromosomal DNA and DNA contained in the mitochondria. The multifunctional vector drawing software ConceptDraw DIAGRAM with the Genogram solution is recommended to design the Genograms and Medical Family Genograms of any complexity and document your family history in a visual view.

kanban board, kanban flow, kanban board agile, kanban board example Kanban Board

kanban board, kanban flow, kanban board agile, kanban board example
Kanban Board solution offers an effective way to build the Kanban boards in an electronic view. This solution includes a lot of Kanban Board samples and the great number of predesigned vector design objects of Task Boards, basic symbols, and icons of caution and markers, communication, complete and numbers, emoji and priorities, sticky notes, and team members. Use all advantages of the Kanban boards, Kanban board agile and ConceptDraw’s Kanban Board solution tools, start with any included Kanban Board example and improve your workflow efficiency and personal effectiveness.

network layout, network floor plan, network visualization, network topologies, network topology mapper Network Layout Floor Plans

network layout, network floor plan, network visualization, network topologies, network topology mapper
Network Layout Floor Plans solution extends ConceptDraw DIAGRAM software functionality with powerful tools for quick and efficient documentation the network equipment and displaying its location on the professionally designed Network Layout Floor Plans. Never before creation of Network Layout Floor Plans, Network Communication Plans, Network Topologies Plans and Network Topology Maps was not so easy, convenient and fast as with predesigned templates, samples, examples and comprehensive set of vector design elements included to the Network Layout Floor Plans solution. All listed types of plans will be a good support for the future correct cabling and installation of network equipment.

Fault Tree Diagram

ConceptDraw DIAGRAM diagramming and vector drawing software offers the Fault Tree Analysis Diagrams Solution from the Industrial Engineering Area of ConceptDraw Solution Park for quick and easy creating the Fault Tree Diagram of any degree of detailing.

Decision Making

Decision Making - ConceptDraw Office suite provides visual tools that are given support on the stage of the decision making. The Seven Management and Planning Tools is a set for such diagrams: Affinity Diagram, Relations Diagram, Prioritization Matrix, Root Cause Tree Diagram, Involvement Matrix, PERT Chart, Risk Diagram (PDPC).

fault tree analysis, fishbone diagram, cause and effect diagrams, fault tree analysis software, fault tree analysis example Fault Tree Analysis Diagrams

fault tree analysis, fishbone diagram, cause and effect diagrams, fault tree analysis software, fault tree analysis example
This solution extends ConceptDraw DIAGRAM.5 or later with templates, fault tree analysis example, samples and a library of vector design elements for drawing FTA diagrams (or negative analytical trees), cause and effect diagrams and fault tree diagrams.

Family Emergency Plan

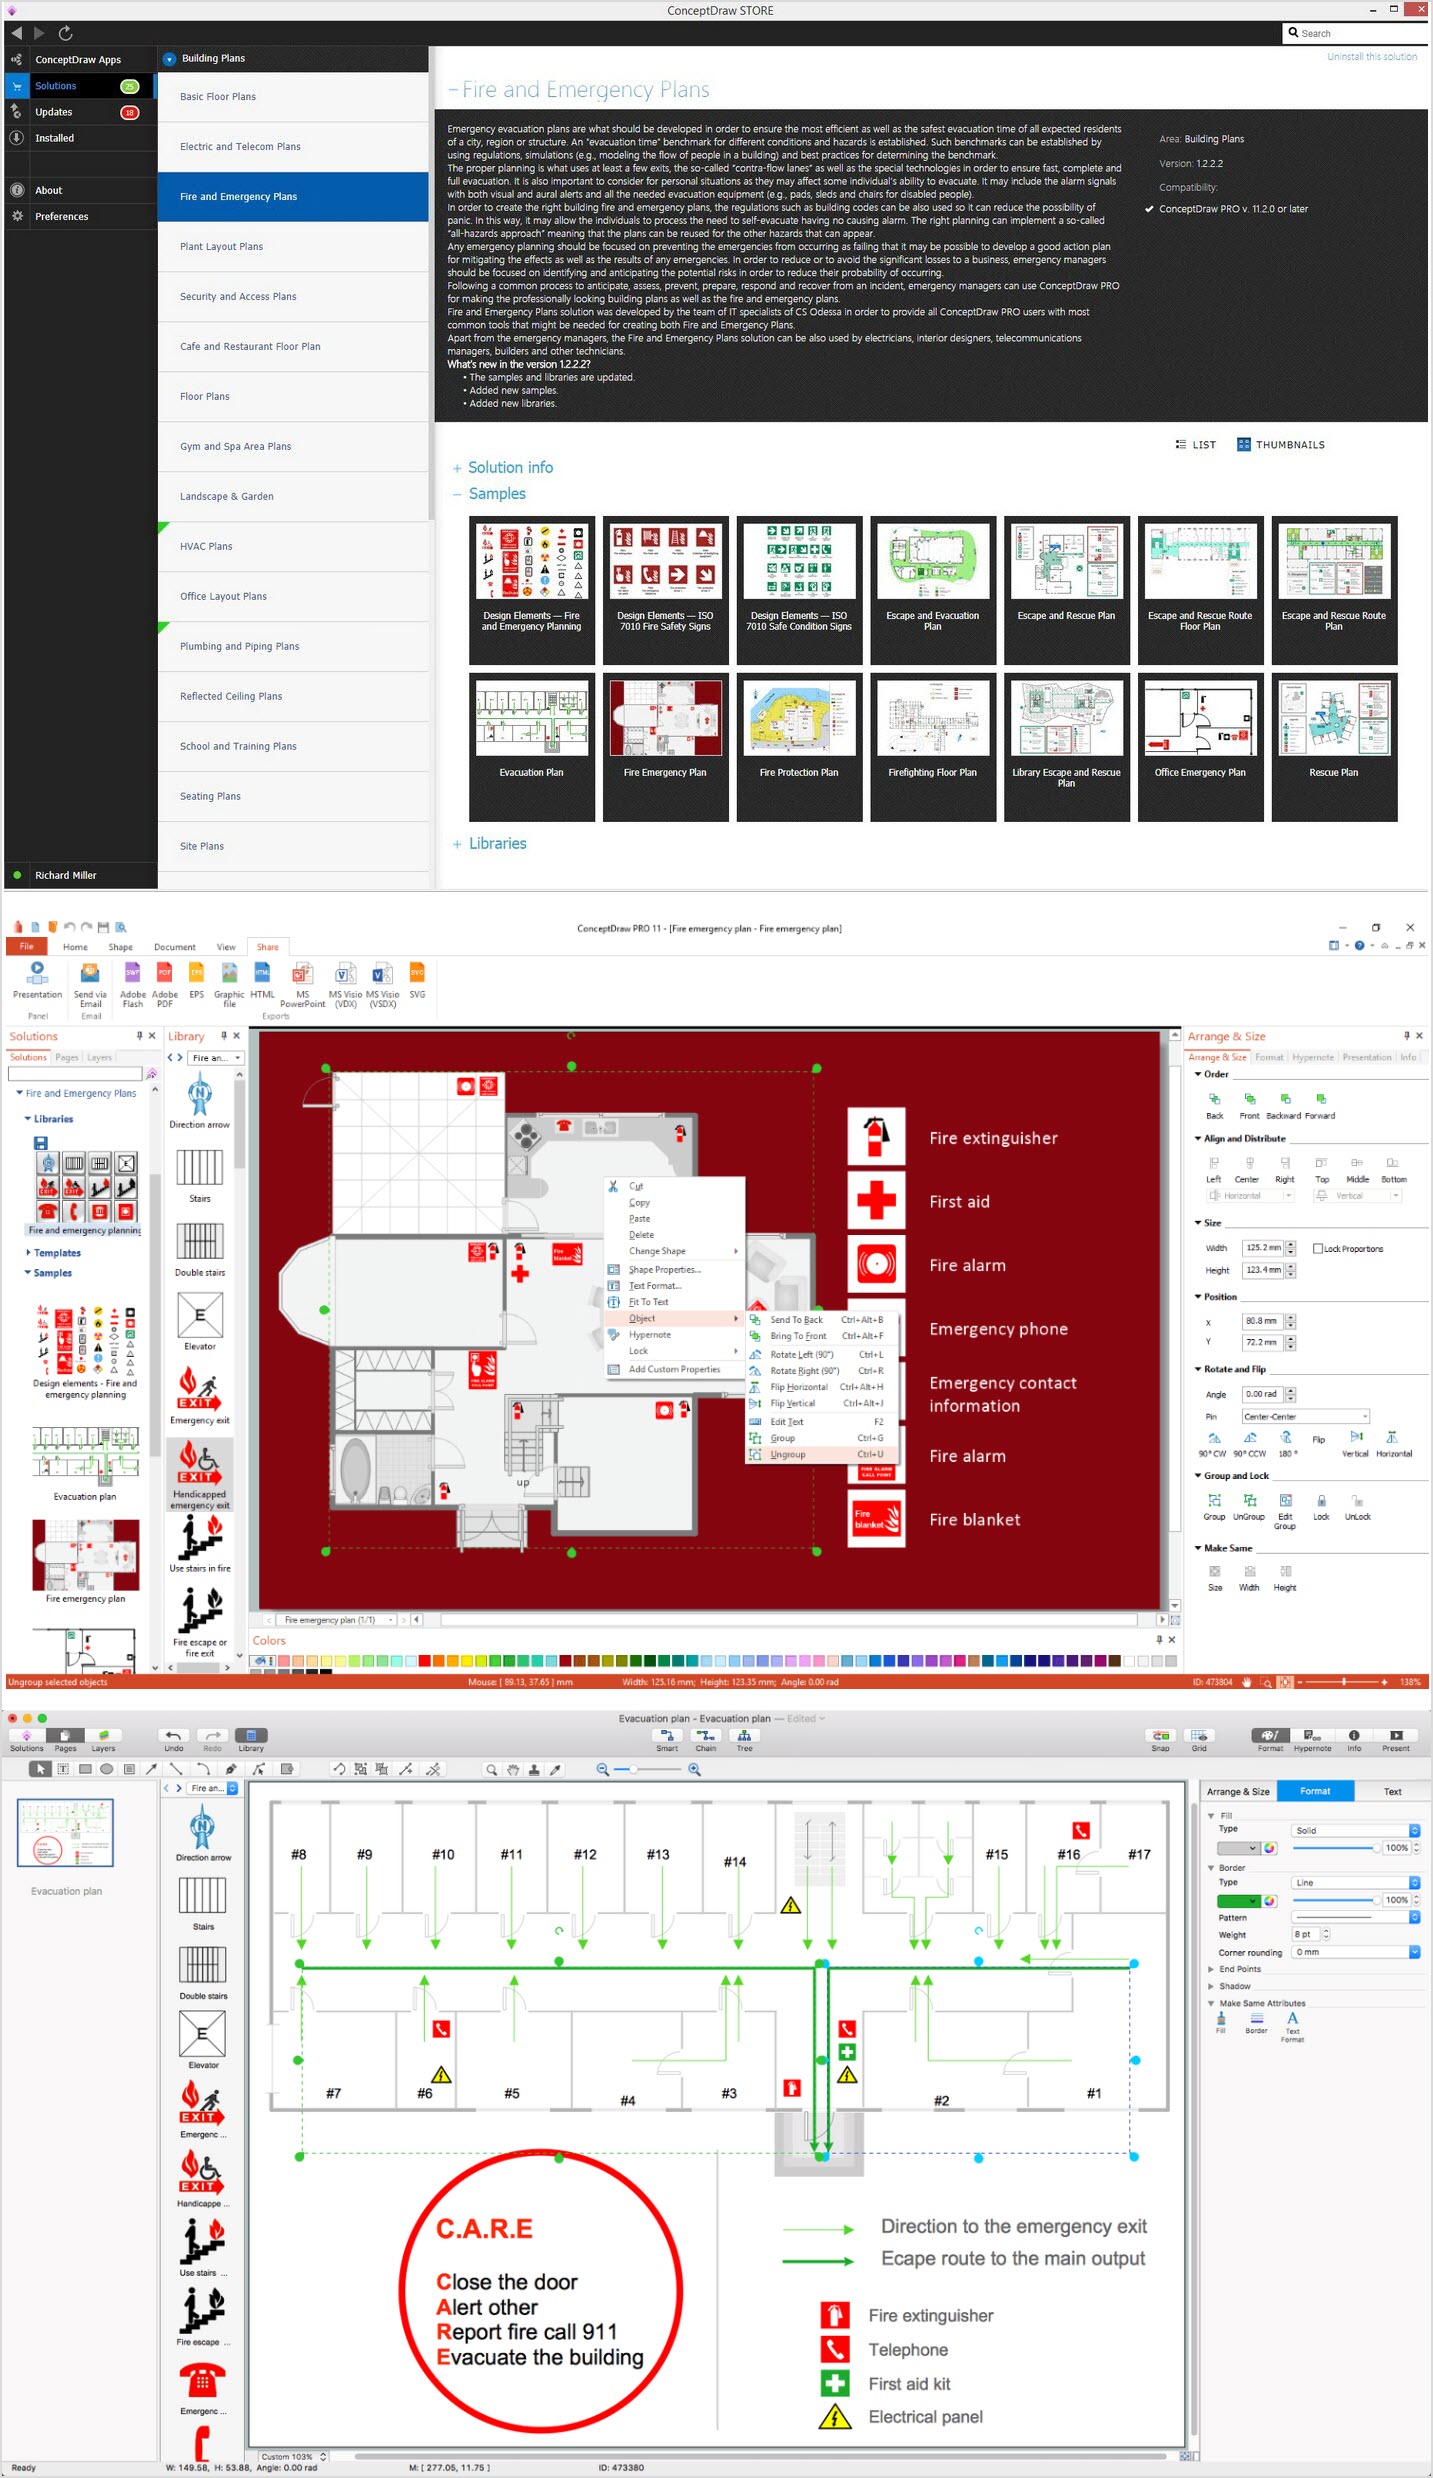
Drawing of Family Emergency Plan is quite complex process. How can you make it? Usually you draw it accurately on the sheet of paper and this process takes much time. ConceptDraw DIAGRAM diagramming and vector drawing software offers you Fire and Emergency Plans Solution - the new method of quickly drawing Family Emergency Plan of any complexity.

decision maker, analytic hierarchy process (ahp), t chart, decision matrix, decision tree analysis Decision Making

decision maker, analytic hierarchy process (ahp), t chart, decision matrix, decision tree analysis
The Decision Making solution offers the set of professionally developed examples, powerful drawing tools and a wide range of libraries with specific ready-made vector decision icons, decision pictograms, decision flowchart elements, decision tree icons, decision signs arrows, and callouts, allowing the decision maker (even without drawing and design skills) to easily construct Decision diagrams, Business decision maps, Decision flowcharts, Decision trees, Decision matrix, T Chart, Influence diagrams, which are powerful in questions of decision making, holding decision tree analysis and Analytic Hierarchy Process (AHP), visual decomposition the decision problem into hierarchy of easily comprehensible sub-problems and solving them without any efforts.

IDEF0 method, IDEF0 notation IDEF0 Diagrams

IDEF0 method, IDEF0 notation
IDEF0 Diagrams visualize system models using the Integration Definition for Function Modeling (IDEF) methodology. Use them for analysis, development and integration of information and software systems, and business process modelling. Having the IDEF0 Diagrams solution as well may lead to getting the professionally-looking drawings based on the pre-made samples and templates from solution. There is also a stencil library with the IDEF0-related design elements that can be taken from this solution in order to draw the IDEF0 diagrams.

EXPRESS data modeling language, data modeling tools, database diagram tool, database design tool, Database Model Diagram, EXPRESS-G data Modeling Diagram

EXPRESS data modeling language, data modeling tools, database diagram tool, database design tool, Database Model Diagram,
EXPRESS-G data Modeling Diagram solution extends the ConceptDraw DIAGRAM software functionality with capabilities of EXPRESS data modeling language, includes powerful data modeling tools, Express-G diagram tool, database diagram tool, database design tool, wide variety of pre-made vector objects of EXPRESS-G notation and EXPRESS-G diagrams samples allowing software developers, software designers, software engineers and other stakeholders to make their data models for information systems, to develop the databases, to learn the principles of construction EXPRESS-G diagrams and helping to draw their own EXPRESS-G Data Modeling Diagrams, Express-G Diagrams or Database Model Diagram without any efforts.

java class. object oriented, object oriented programming concepts, classes, object oriented programming, python class Class Hierarchy Tree

java class. object oriented, object oriented programming concepts, classes, object oriented programming, python class
Class Hierarchy Tree solution enhances the ConceptDraw DIAGRAM and ConceptDraw MINDMAP software functionalities with a wide collection of samples and a large set of pre-made vector shapes, smart and direct connectors allowing all IT and web specialists, web-designers, web-programmers, and lecturers to design the Class Hierarchy Trees and Class Diagrams, object oriented classes, making easier the object oriented programming, illustrating the object oriented programming concepts, the generalization and inheritance in Java class and Python class, as well as designing the Class Hierarchy Mind Maps and autogenerating them in Class Tree Diagrams in ConceptDraw DIAGRAM files.

Decision Tree Analysis

Decision trees are widely used in operations research. It is mostly applied in decision analysis in order to help and identify that strategy that most likely may lead to reaching a goal. It is also known as a popular tool in machine learning, thus it worth knowing about it from this article.

The ConceptDraw DIAGRAM diagramming and drawing software is the one that can help with creating the needed drawing, including a decision tree. Making decision tree analysis, it is always easy to make the needed matrix as there are plenty of pre-made templates to be used.

wireframe tools, wireframing, wire frame, website wireframe, interface design, wireframe examples Website Wireframe

wireframe tools, wireframing, wire frame, website wireframe, interface design, wireframe examples
The innovative Website Wireframe solution enhances the ConceptDraw DIAGRAM functionality with newest wireframe tools, libraries with variety of predesigned icons, symbols, buttons, graphics, forms, boxes, and many other vector elements, templates and professionally designed samples, which make it the best wireframing software. Website Wireframe solution gives you significant advantages when designing and maintaining websites, creating skeletal and content-free depictions of website structure, making website prototypes and planning the content arrangement before committing to design, also speeds up the processes of sketching, producing and sharing wireframe examples of website style and interface design.