HelpDesk
How to Create Organizational Chart Quickly
Use ConceptDraw MINDMAP for generating structured data on organization structure and then ConceptDraw DIAGRAM for presenting the results as chart.HelpDesk
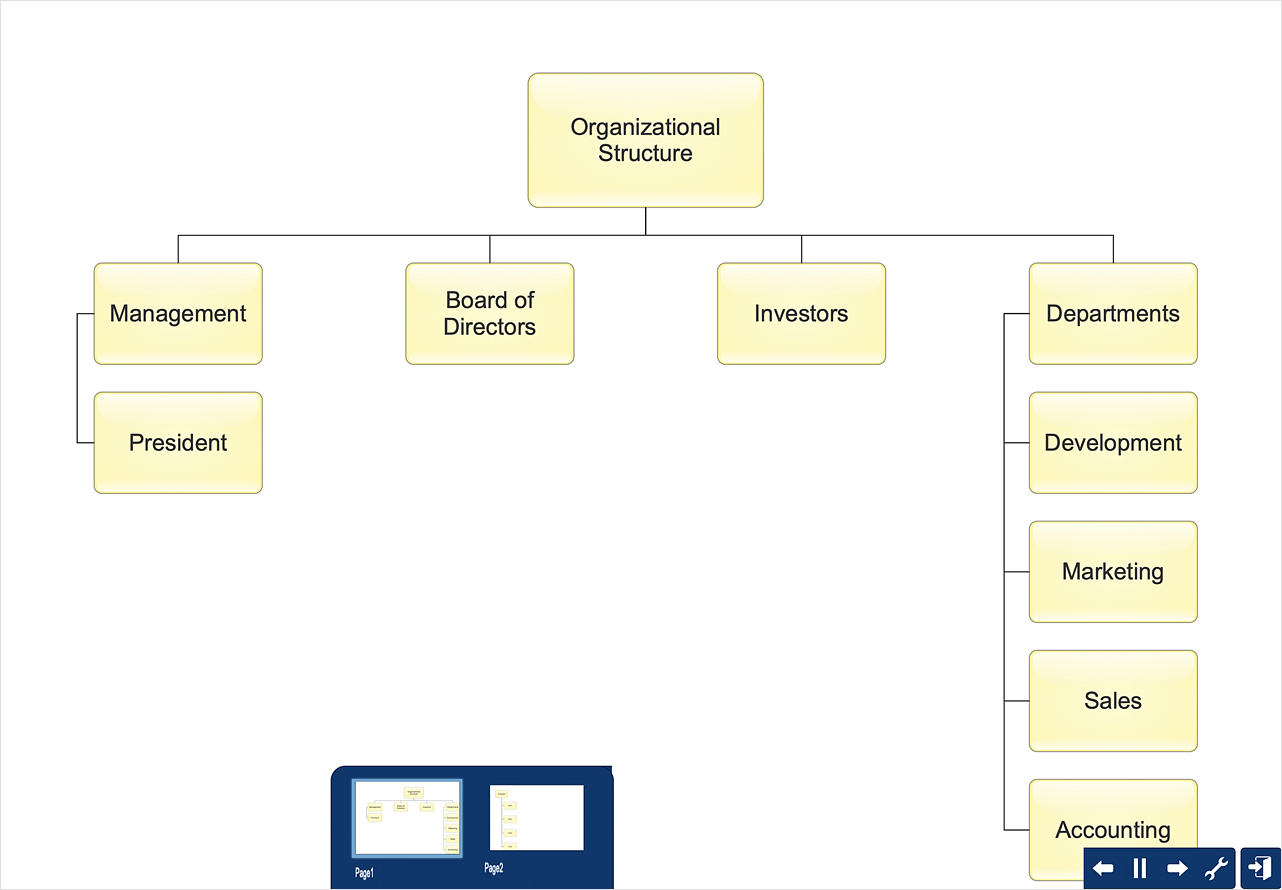
How to Draw an Organizational Chart
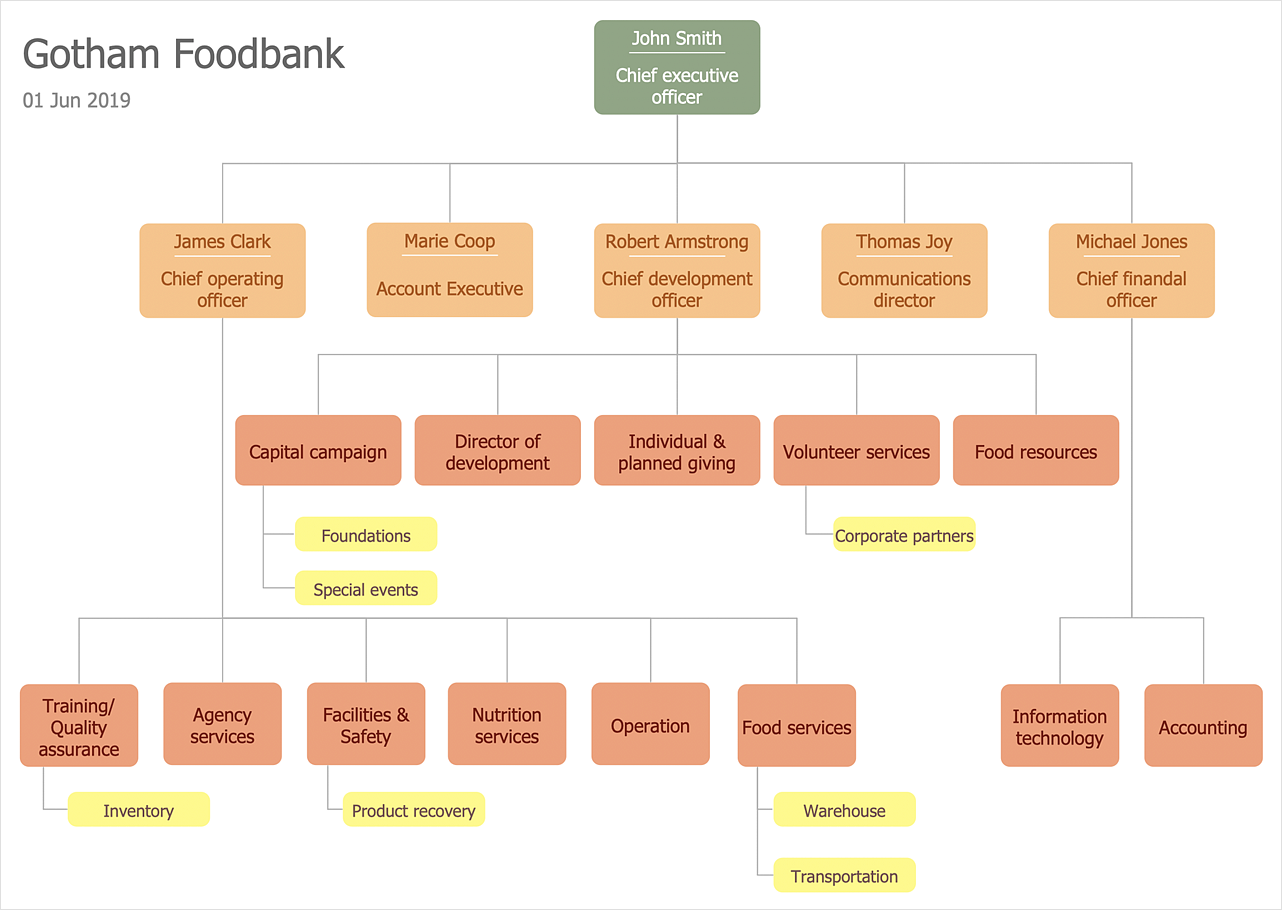
Polish your diagram appearance using the tools provided in the Format panel. The organizational chart software is a valuable tool for modern business. It is important for any business to build a clear organizational structure that determines the responsibilities and relationships between different positions in the organization. The clear structured organization - means the clear structured business workflow, which is the core of success in the business. ConceptDraw DIAGRAM is an org chart software that allows you to draw an organizational structure of your company quickly and easily.
 25 Typical Orgcharts
The 25 Typical Orgcharts solution contains powerful organizational structure and organizational management drawing tools, a variety of professionally designed organization chart and matrix organization structure samples, 25 templates based on various orga
 Management
This solution extends ConceptDraw DIAGRAM and ConceptDraw MINDMAP with Management Diagrams and Mind Maps (decision making, scheduling, thinking ideas, problem solving, business planning, company organizing, SWOT analysis, preparing and holding meetings
 PM Teams
This solution extends ConceptDraw Office 2.0 products with a single information space for messaging to teams.
HelpDesk
How to Draw a Pyramid Diagram
Pyramid diagram (triangle diagram) is used to represent data, which have hierarchy and basics. Due to the triangular form of the diagram, each pyramid section has a different width. The width of the segment shows the level of its hierarchy. Typically, the top of the pyramid is the data that are more important than the base data. A pyramid scheme can be used to show proportional and hierarchical relationships between some logically related items, such as departments within an organization, or successive elements of any process. This type of diagram is often used in marketing to display hierarchically related data, but it can be used in a variety of situations. ConceptDraw DIAGRAM allows you to make a pyramid diagram, quickly and easily using special libraries.HelpDesk
How to Create an Active Directory Diagram
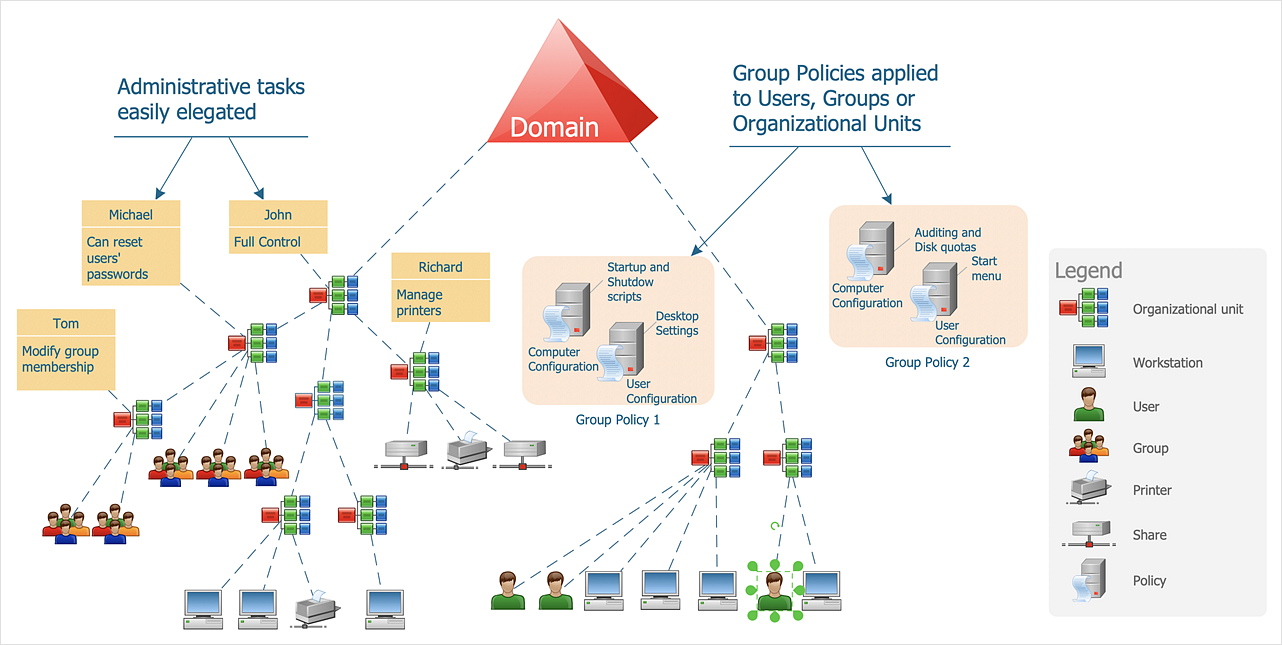
Active Directory Service represents a distributed database that contains all the domain objects. The Active Directory domain environment is a single point of authentication and authorization of users and applications across the enterprise. The domain of the organization and deployment of Active Directory Service are exactly the cornerstones of the enterprise IT infrastructure. The logical diagrams of MS Windows Active Directory structure are used to visually support an enterprise IT infrastructure planning and management. ConceptDraw DIAGRAM allows you to make AD Diagrams quickly and easily using the set of special libraries.Business diagrams & Org Charts with ConceptDraw DIAGRAM
The business diagrams are in great demand, they describe the business processes, business tasks and activities which are executed to achieve specific organizational and business goals, increase productivity, reduce costs and errors. They let research and better understand the business processes. ConceptDraw DIAGRAM is a powerful professional cross-platform business graphics and business flowcharting tool which contains hundreds of built-in collections of task-specific vector stencils and templates. They will help you to visualize and structure information, create various Business flowcharts, maps and diagrams with minimal efforts, and add them to your documents and presentations to make them successful. Among them are Data flow diagrams, Organization charts, Business process workflow diagrams, Audit flowcharts, Cause and Effect diagrams, IDEF business process diagrams, Cross-functional flowcharts, PERT charts, Timeline diagrams, Calendars, Marketing diagrams, Pyramids, Target diagrams, Venn diagrams, Comparison charts, Analysis charts, Dashboards, and many more. Being a cross-platform application, ConceptDraw DIAGRAM is very secure, handy, free of bloatware and one of the best alternatives to Visio for Mac users.
HelpDesk
How to Create a Fishbone (Ishikawa) Diagram Quickly
A Fishbone (Ishikawa) diagram is also called cause-and-effect diagram. Fishbone diagram is often used in business to determine the cause of some problem. The diagram illustrates the main causes and sub-causes leading to an event. The main goal of the Fishbone diagram is to illustrate in a graphical way the relationship between a given outcome and all the factors that influence this outcome. The complete diagram resembles a fish skeleton as its name implies. The ability to create a Fishbone Diagram is supported by the Fishbone Diagram solution. Use ConceptDraw MINDMAP for structuring data and then ConceptDraw DIAGRAM for generating a Fishbone Diagram from mind map structure.Cisco Network Templates
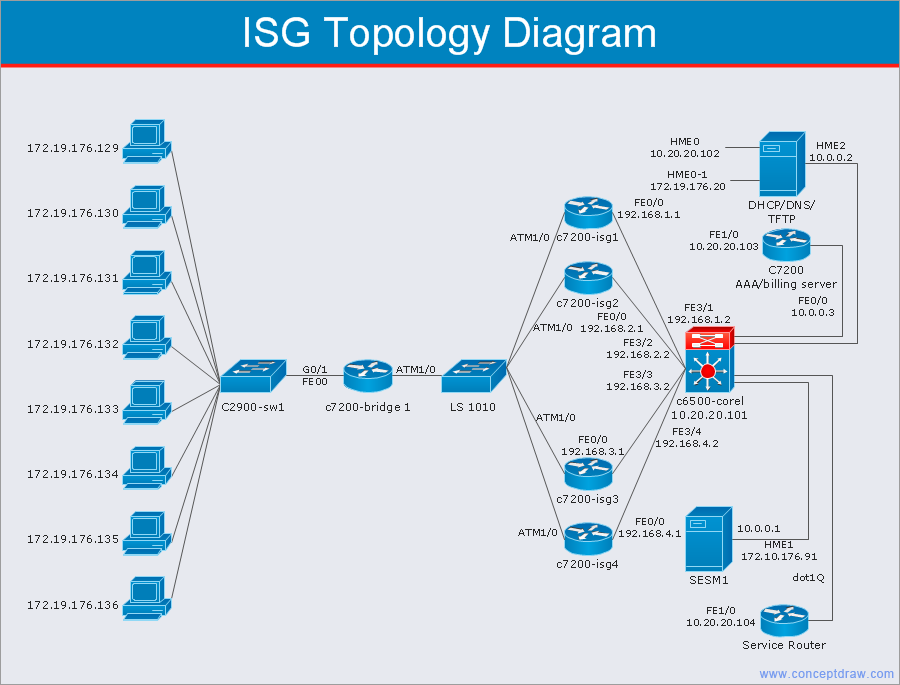
Cisco is a huge multinational company that develops and sells worldwide the]network equipment, mainly for large organizations and telecommunication companies. So, it has large number of enterprise clients in a corporate environment. Therefore many network engineers often draw the Network diagrams for Cisco hardware and are needed in a powerful vector drawing software. ConceptDraw DIAGRAM is ideal for this goal, enhanced with professional Cisco Network Diagrams solution from Computer and Networks area of ConceptDraw Solution Park it offers a wide variety of vector design objects libraries, samples and also large set of Cisco network templates. The use of templates is the easiest and time-saving way of drawing professional-looking diagrams and schematics. Use them to design Cisco Network Topologies, Cisco Network Diagrams, Cisco ISG Topology Diagrams, Cisco Express Forwarding Diagrams, Rack Diagrams, Network Organization Charts, Wireless Computer Network Diagrams, Vehicular Network Diagrams, and many other types of diagrams without efforts.
- How to Draw an Organization Chart | Organizational Structure ...
- How to Draw an Organization Chart | How to Create Organizational ...
- ConceptDraw PRO - Organizational chart software | How to Create ...
- How to Draw an Organization Chart | Pie Chart Examples and ...
- How to Draw an Organization Chart | How to Create Organizational ...
- Organizational chart software
- How to Create Organizational Chart Using Management Solution ...
- How to Draw an Organization Chart | Organizational Structure | How ...
- Organizational Chart Template
- How to Draw an Organization Chart | ConceptDraw PRO ...
- How to Draw a Bubble Chart | ConceptDraw PRO - Organizational ...
- How to Draw an Organization Chart | ConceptDraw PRO ...
- Orgchart | Horizontal Orgchart | Business Board Org Chart | Orgchart
- Organizational Structure | Company's organizational chart | How to ...
- Organizational Charts with ConceptDraw PRO
- ConceptDraw PRO - Organizational chart software | How to Draw an ...
- Business Diagram Software | Org chart - University | Business ...
- How to Draw an Organization Chart | Marketing and Sales ...
- Organizational Charts | How to Draw an Organization Chart | How to ...


