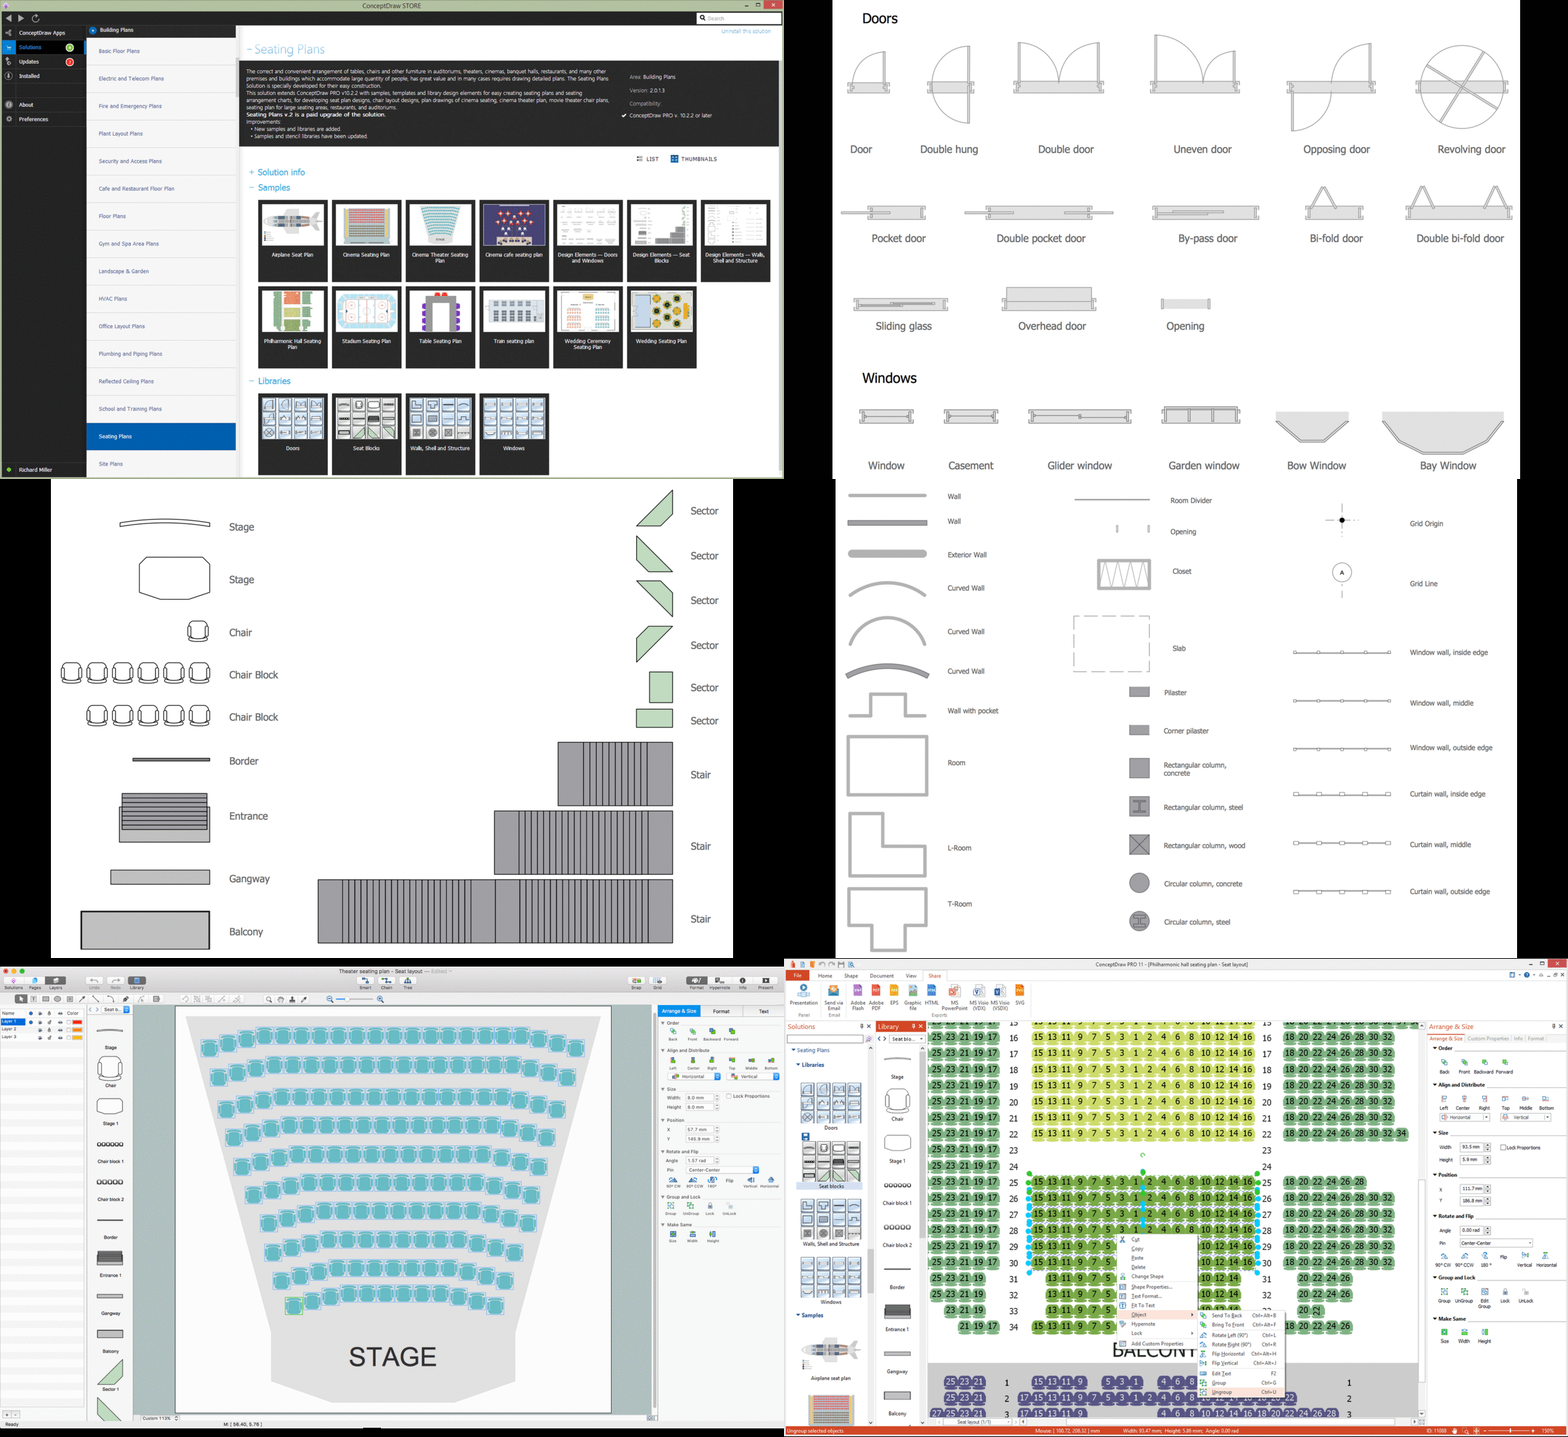
Building Drawing Software for Design Seating Plan
A Seating Plan is a scheme that illustrates the arrangement of seats on the plan of specific place. The seats can be located separately or grouped in rows like in stadiums. Usually they are numerated allowing spectators to choose them beforehand and have a guaranteed seat. It is especially useful for cinemas and theaters, where the places differ according to their price range. When all seatings are equal, it is used the open seating scheme and each client can choose any free seat. Each of these seating systems has many own advantages, it is also possible to mix them. Seating Plans, Schemes and Drawings are popular and widely used for purchase and sale the entering tickets to theatres, cinemas, stadiums, trains, airplanes, etc. They are also useful for beforehand planning and assignment the seats on weddings, banquets, and other events. ConceptDraw DIAGRAM enhanced with Seating Plans solution offers the helpful building drawing software tools for design Seating Plan using the predesigned templates and vector elements of doors, windows, walls, seats, etc.
ConceptDraw DIAGRAM ER Diagram Tool
Entity-relationship model, also called ER-model, is the main tool of domain modeling on the stage of conceptual design. The modeling of domain data structures is based on the use of graphical tools - Entity-Relationship diagrams (ER-diagrams). The core concepts of ER-Diagram are entity, attribute and relationship. ER-diagram lets visually represent the entities, helps effectively document all properties of designed system and to detail the data storages. To represent the elements at ER-model are commonly used Chen’s notation and Crow’s foot notation, each has its pros and cons. The entity on ER-diagram is represented in the form of rectangle, which specifies its name. An attribute is a property of the entity and relationship is an interaction between the entities. The relationship between two entities is called binary, between more than two entities - ternary. Specific software, such as ConceptDraw DIAGRAM with Entity-Relationship Diagram (ERD) solution from ConceptDraw Solution Park is helpful for easy creation Entity-Relationship Diagrams.Work Order Process Flowchart. Business Process Mapping Examples
The business process is a set of actions or tasks which are undertaken by an organization for production some goods or services, they are then offered for the customers and are ordered by them. Process Flowcharts and Order Process Flowcharts are sufficiently prevalent, well known and actively used in variety of fields of life, business and science. They are constructed using the common standardized symbols, thus are clear and understandable for all. They help effectively represent the processes, determine the order in which the process activities happen, document the order processes, and also effectively analyze the processes with a goal to increase their efficiency. Create your own Process Flowcharts, Order Process Flowcharts, Cross-Functional Flow Charts representing the order processing steps using powerful drawing tools of ConceptDraw DIAGRAM software and variety of predesigned vector objects from the libraries of Business Process Mapping Solution from Business Processes area of ConceptDraw Solution Park.Contoh Flowchart
The Flowcharts are graphical representations of algorithms, processes or step-by-step solutions problems. There are many different types of Flowcharts, among them Process Flowchart, Cross Functional Flowchart, Data Flow Diagram, IDEF Flowchart, Workflow Diagram, Contoh Flowchart and many others. They have especial value when you need represent a complex process, depict in details the process of solution problems, efficiently plan and set the tasks priorities. The Flowcharts must to be constructed brief, clear and logical, simplifying the process or procedure, and making easier the comprehension and perception of information. The ConceptDraw DIAGRAM software makes the process of creating the flowcharts of any types well organized and clear for developers and customers also, including the Contoh Flowchart. It is possible due to the Flowcharts solution from ConceptDraw Solution Park, its predesigned vector objects, templates, and a lot of professional-looking practical samples and examples which can be quick and easy modified, printed, or published on web.What is a Cross Functional Flow Chart?
For those who want to know what is a cross functional flowchart and how to draw it, we preared a special library and professional looking templates. Take all the advantage of your drawing software to learn and create such a well-designed flowcharts. Watch the HowTo video to learn more.Selecting & Creating Flowcharts
ConceptDraw Flowcharts visualize a process or algorithm of program as step/operation blocks of various shapes connected with arrowed lines showed the process flow direction. They are used to visualize business or technical processes and software algorithms.Powerful Drawing Feature for Creating Professional Diagrams
This will let you create professional diagrams and charts using its simple RapidDraw option just in clicks. Take a look on a diagram you are looking for and create it fast and quickly.- Er Diagram Of Publishing House
- Erd Of Publishing House
- Publishing House Designing A Flowchart Diagram
- Draw Er Diagram Of A Publishing House
- Draw Publishing House Of Erd
- Publishing Process Flow Chart
- Er Diagram For Publishing House System
- Publishing Process Flow Chart Diagram
- Create A Flowchart And Publish To Website


