 Event-driven Process Chain Diagrams
Event-driven Process Chain (EPC) Diagram is a type of flowchart widely used for modeling in business engineering and reengineering, business process improvement, and analysis. EPC method was developed within the Architecture of Integrated Information Systems (ARIS) framework.
 Entity-Relationship Diagram (ERD)
Entity-Relationship Diagram (ERD) solution extends ConceptDraw PRO software with templates, samples and libraries of vector stencils from drawing the ER-diagrams by Chen's and crow’s foot notations.
HelpDesk
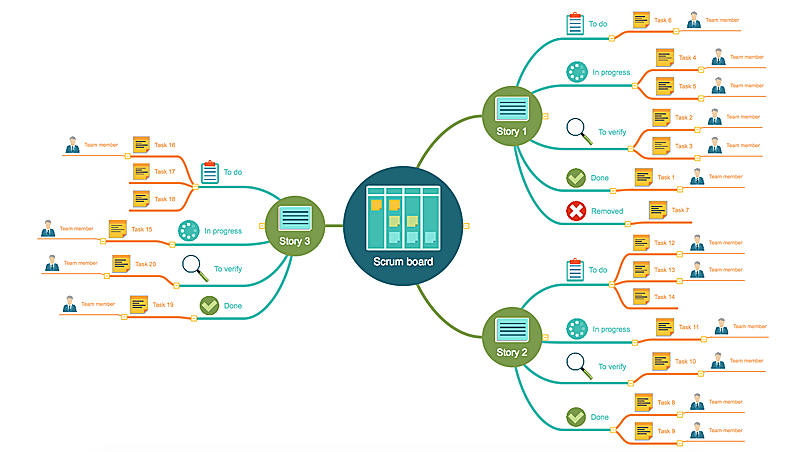
Agile Mind Maps: Exploring the User Wishes
Agile method advocate use cases and user stories, but there are no standard processes or guides available to help gather user requirements. That is why documenting user requirements can be challenging. Without strong communication experience the scrum process can collapse, leading towards unfruitful requirements and imperfect software. This article offers a path to overcome these hurdles through the simplicity and clearness of mind mapping. ConceptDraw Scrum Worflow solution lets explore the user requirements for your Agile development project before they are formalized. You can easily create professional Mind Maps that will effectively collect and structure the information on what a user actually wants, or the “User Wish.”
 Value Stream Mapping
Value stream mapping solution extends ConceptDraw PRO software with templates, samples and vector stencils for drawing the Value Stream Maps (VSM) in lean manufacturing practice.
Flowchart by Hapman
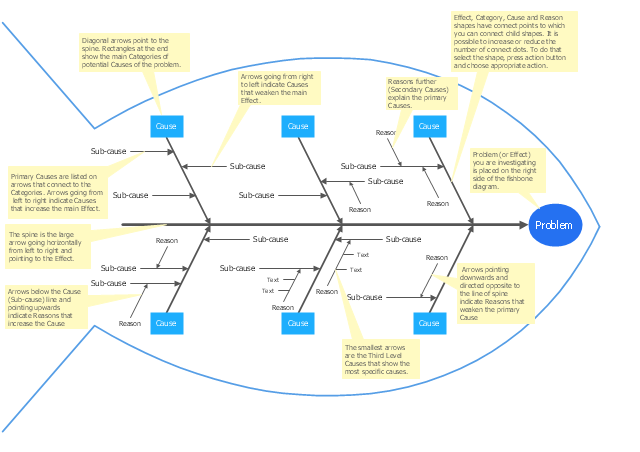
Do you need a flowchart or to sketch out a process? Download the Flowchart by Hapman app for FREE today!!!"Cause-and-effect diagrams can reveal key relationships among various variables, and the possible causes provide additional insight into process behavior.
Causes can be derived from brainstorming sessions. These groups can then be labeled as categories of the fishbone. They will typically be one of the traditional categories mentioned above but may be something unique to the application in a specific case. Causes can be traced back to root causes with the 5 Whys technique." [Ishikawa diagram. Wikipedia]
"The 5 Whys is an iterative question-asking technique used to explore the cause-and-effect relationships underlying a particular problem. The primary goal of the technique is to determine the root cause of a defect or problem. (The "5" in the name derives from an empirical observation on the number of iterations typically required to resolve the problem.)" [5 Whys. Wikipedia]
This Ishikawa diagram (cause and effect diagram) template is included in the Fishbone Diagram solution from the Management area of ConceptDraw Solution Park.
- Sample Er Diagram By Chen With Question And Answer
- Four Circle Ven Diagram Math Question With Solution
- Entity-Relationship Diagram (ERD) | Crow Foot And Chain Notation ...
- Questions And Answers On Erd Diagram Using Crow S Foot
- Mathe Question And Solution Of Network Diagram
- Enhanced Er Diagram Examples Questions
- Probability Quality Control Tools | Definition TQM Diagram | Total ...
- Sample Flowchart Questions And Their Answers
- Entity Relationship Diagram Software Engineering | ERD Symbols ...
- Questions On Flowchart Dat Related To Accounting
- Question And Answer On Extended Entity Relationship Diagram In
- Building Social Media Response Plan DFD | Data Flow Diagrams ...
- Sample Of Flowchart With Question
- Advanced Erd Crow Foot Question And Answer
- Pyramid Diagram Question
- Entity-Relationship Diagram (ERD)
- Switch Diagram Question Network
- Questions And Answers On Crow Foot Er Diagram
- Erd Examples Question In Database


