 Spatial Infographics
Spatial infographics solution extends ConceptDraw PRO software with infographic samples, map templates and vector stencils libraries with design elements for drawing spatial information graphics.
HelpDesk
How to Create Infographics Using the Spatial Infographics Solution
Tips on how to use ConceptDraw Spatial Infographics Solution. Now you got the tool for quick and easy drawing and presenting of your own simple Spatial Infographics documents.How to Create a Powerful Infographic When You do not Have a Designer
Create a powerful infographic, become inspired by the people with ConceptDraw.
 ConceptDraw Solution Park
ConceptDraw Solution Park collects graphic extensions, examples and learning materials
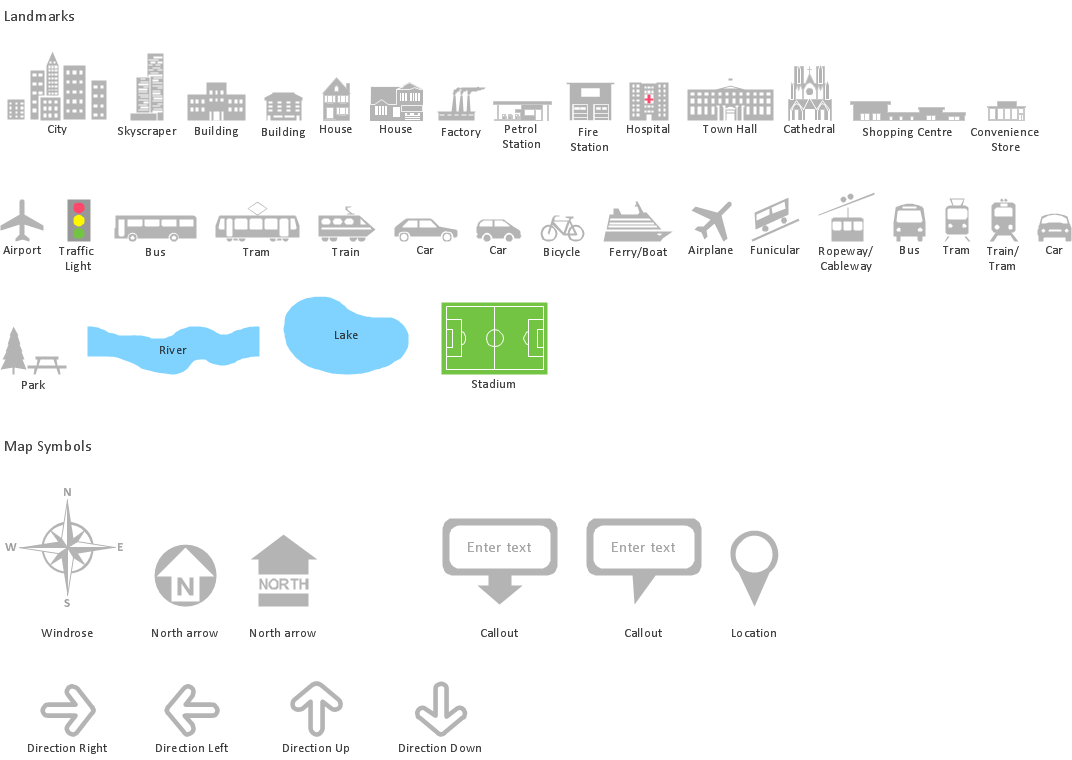
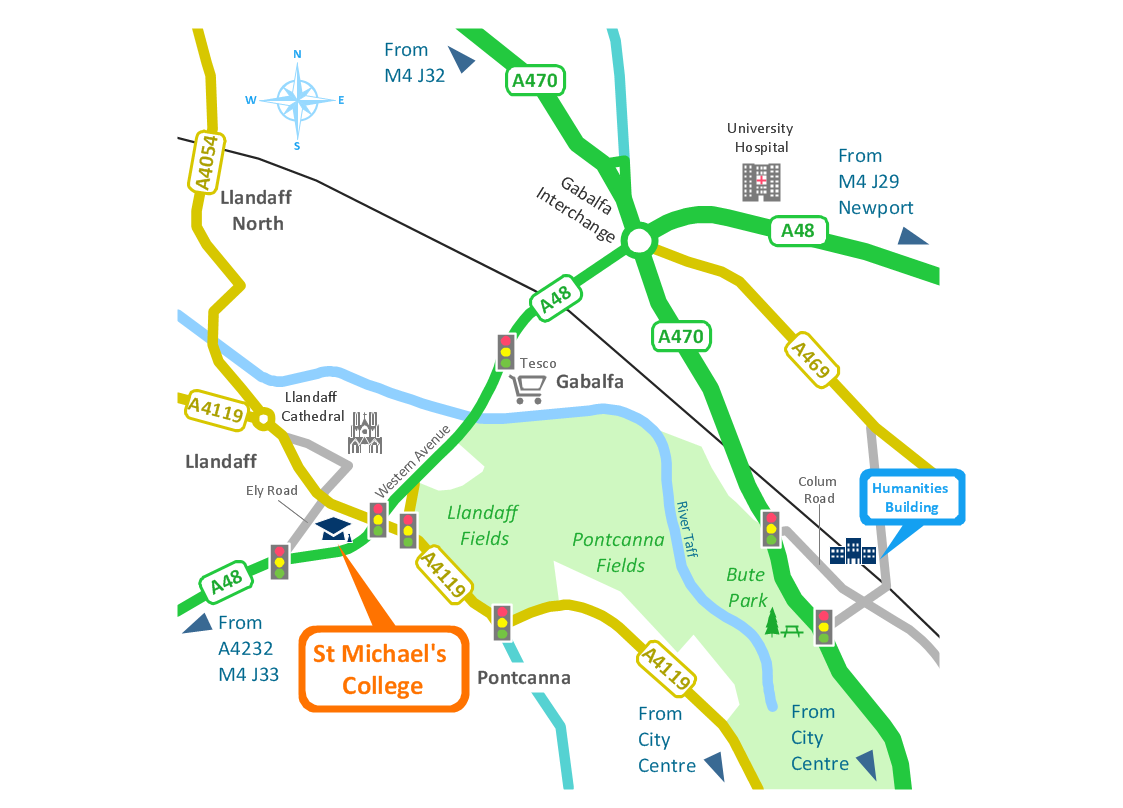
Spatial infographics Design Elements: Location Map
Infographic Design Elements for visually present various geographically distributed information.Tools to Create Your Own Infographics
Over the past few centuries, data visualization has evolved so much that we use it every day in all areas of our lives. Many believe that infographic is an effective tool of storytelling, as well as analytics, and that it is able to overcome most of the language and educational barriers. Understanding the mechanisms of human perception will help you to understand how abstract forms and colors used in data visualization can transmit information more efficient than long paragraphs of text.Spatial Infographics
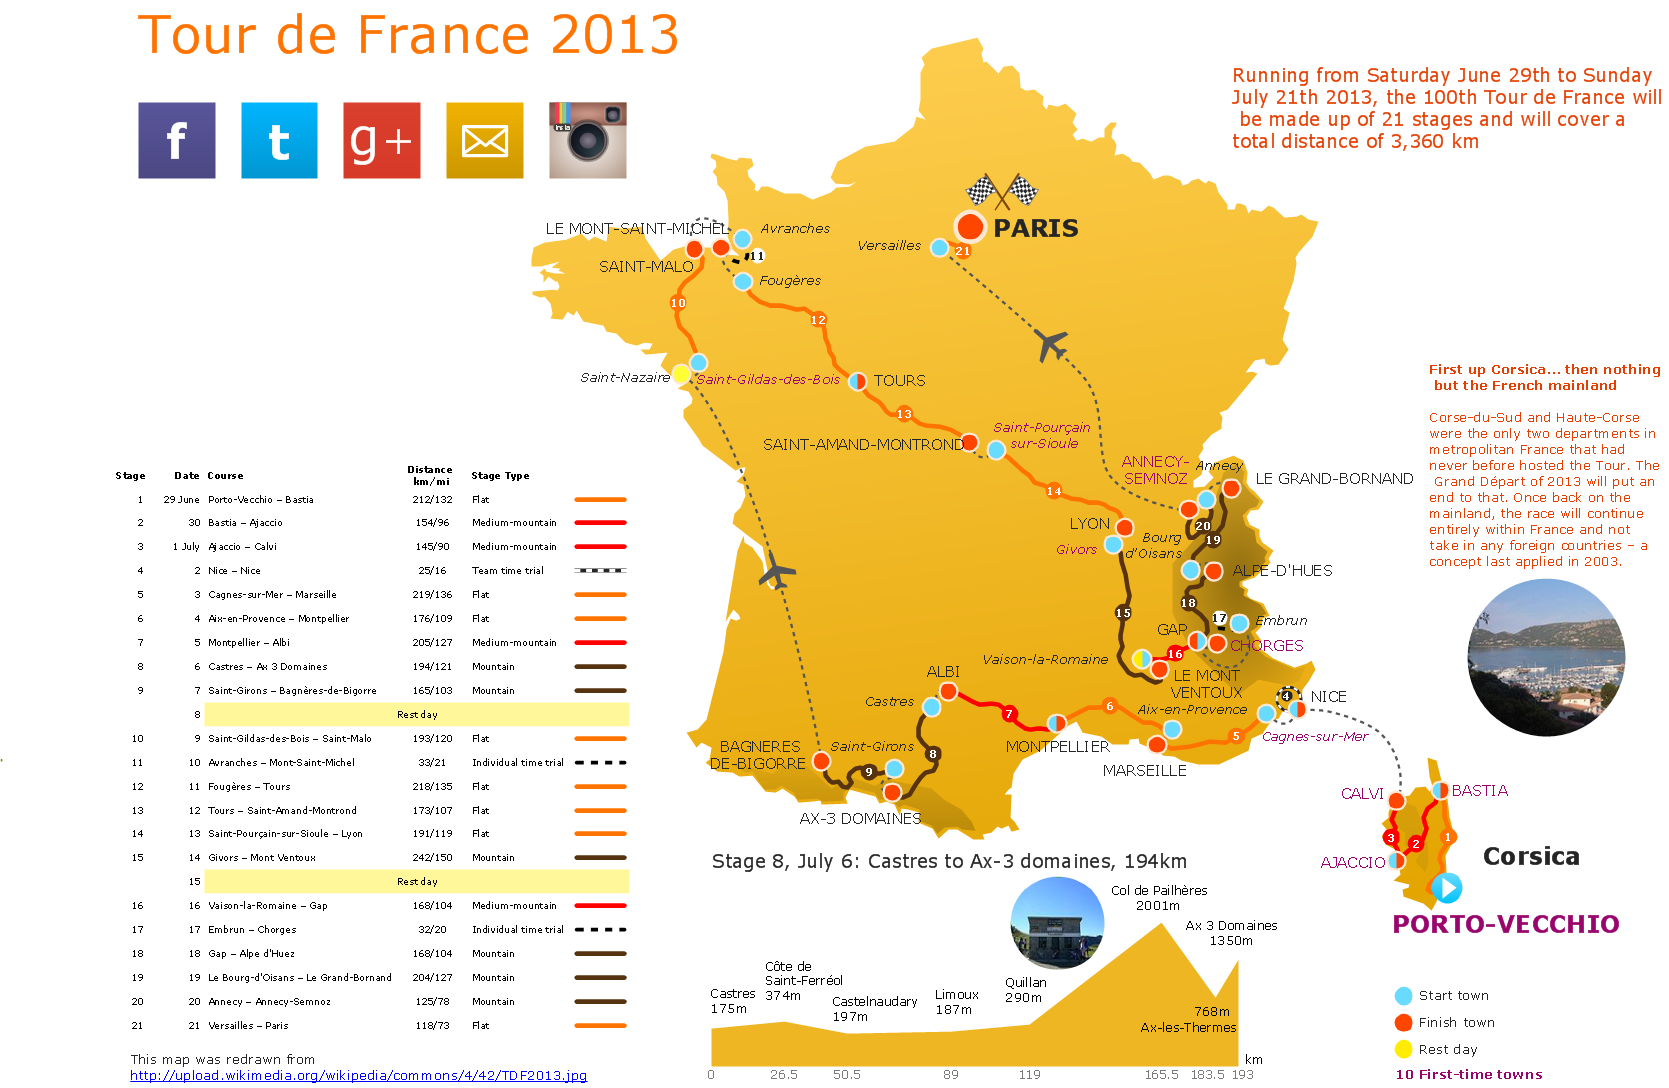
Not everyone can make spatial infographics from scratch, ConceptDraw will help you to create your own infographics.Map Infographic Design
ConceptDraw collection of vector elements for infographics design.Map Infographic Tool
ConceptDraw is a data visualization tool, which can help you to create a map infographics. Anyone can do this, it's that easy!Tools for Creating Infographics and Visualizations
ConceptDraw lets you express your professional accomplishments in a simple, but compelling personal infographics and visualizations.Visualization Spatial Data Using Thematic Maps Combined with Infographics
Now anyone can build an infographics from their data using ConceptDraw.Nice and simple, but the features it have are power-packed!
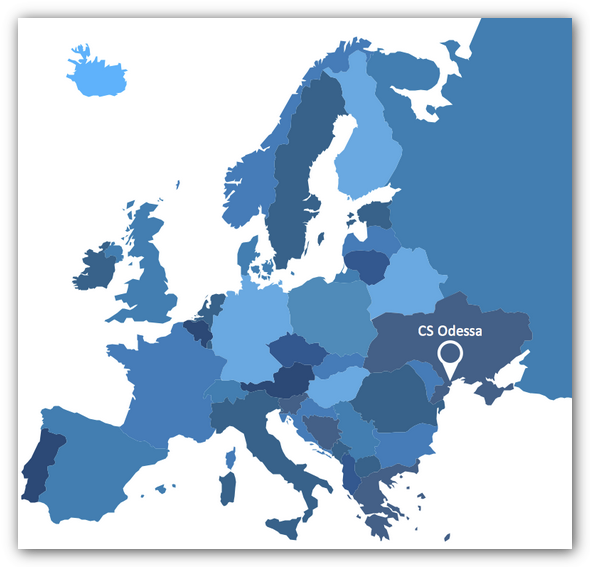
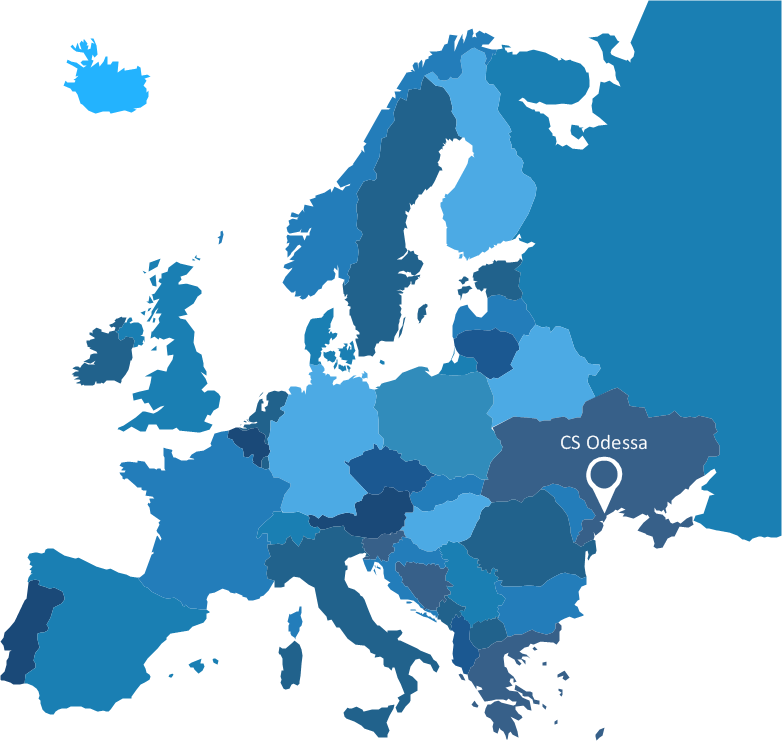
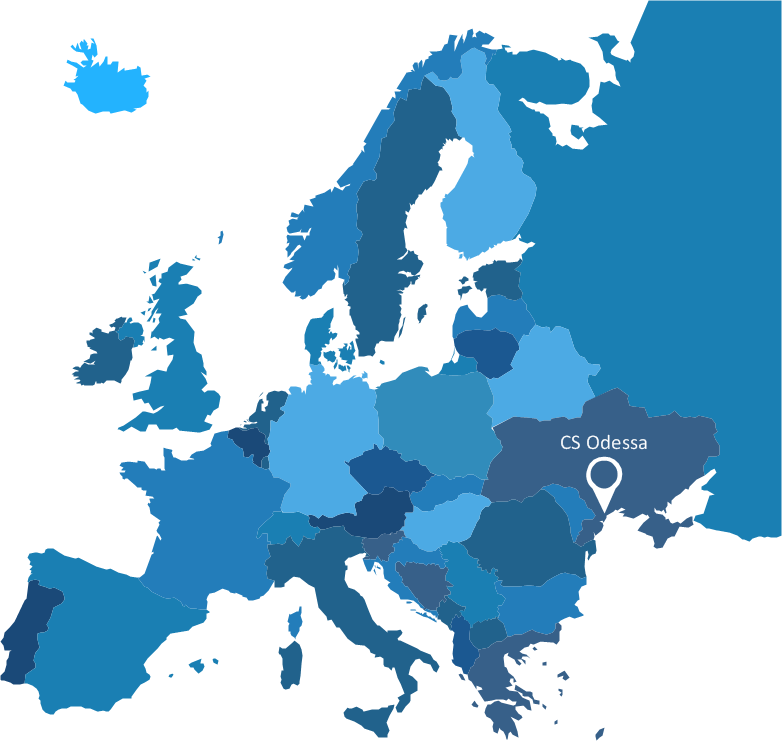
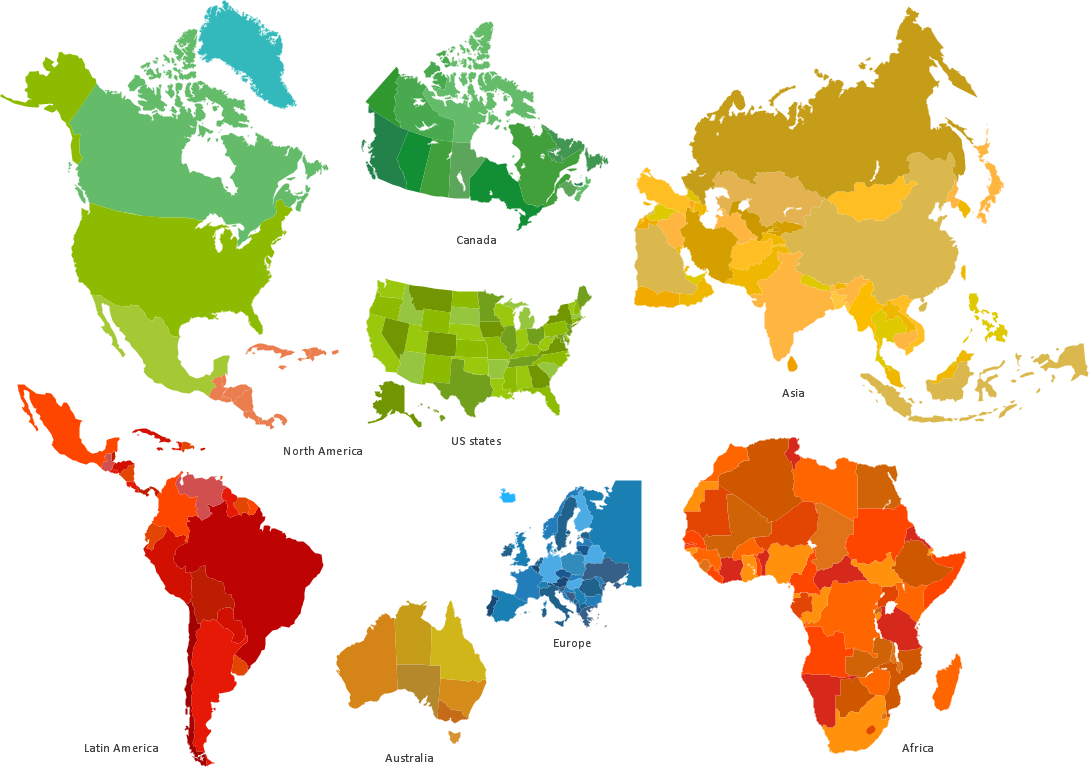
Spatial infographics Design Elements: Continental Map
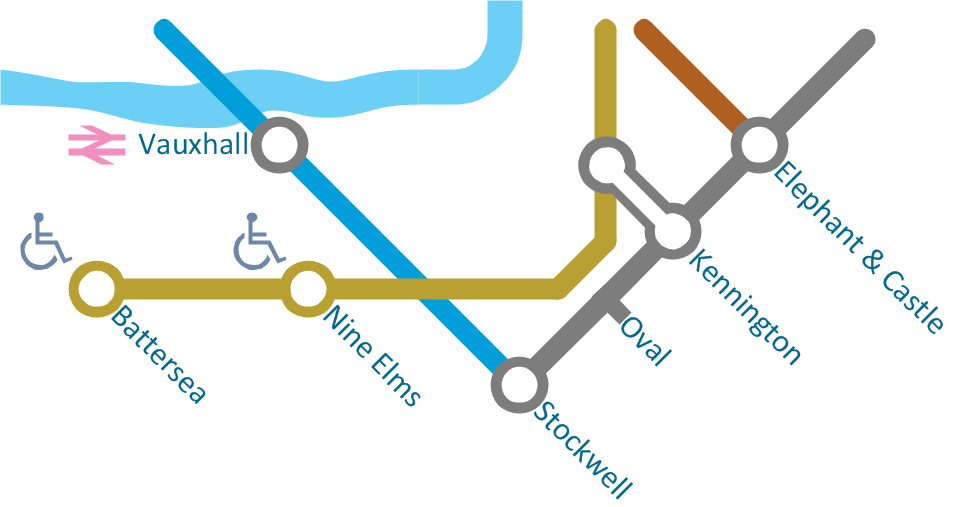
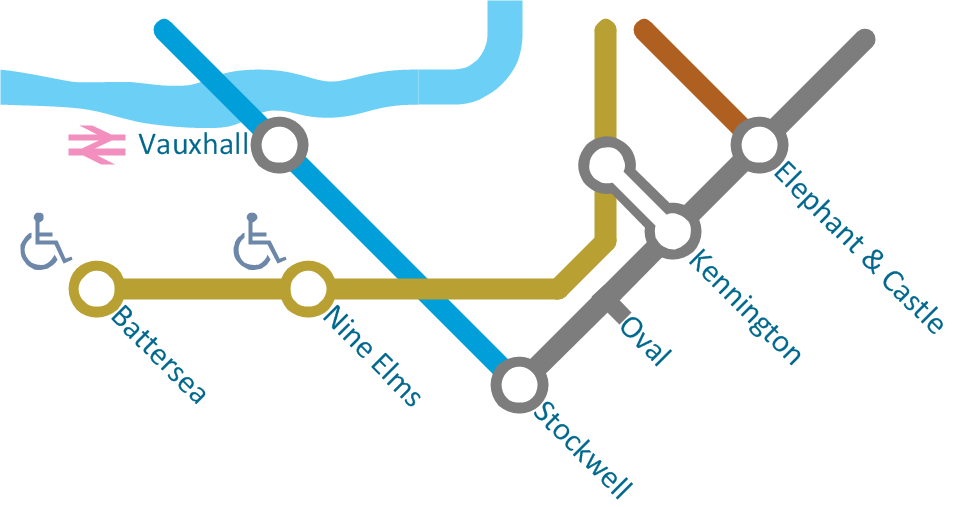
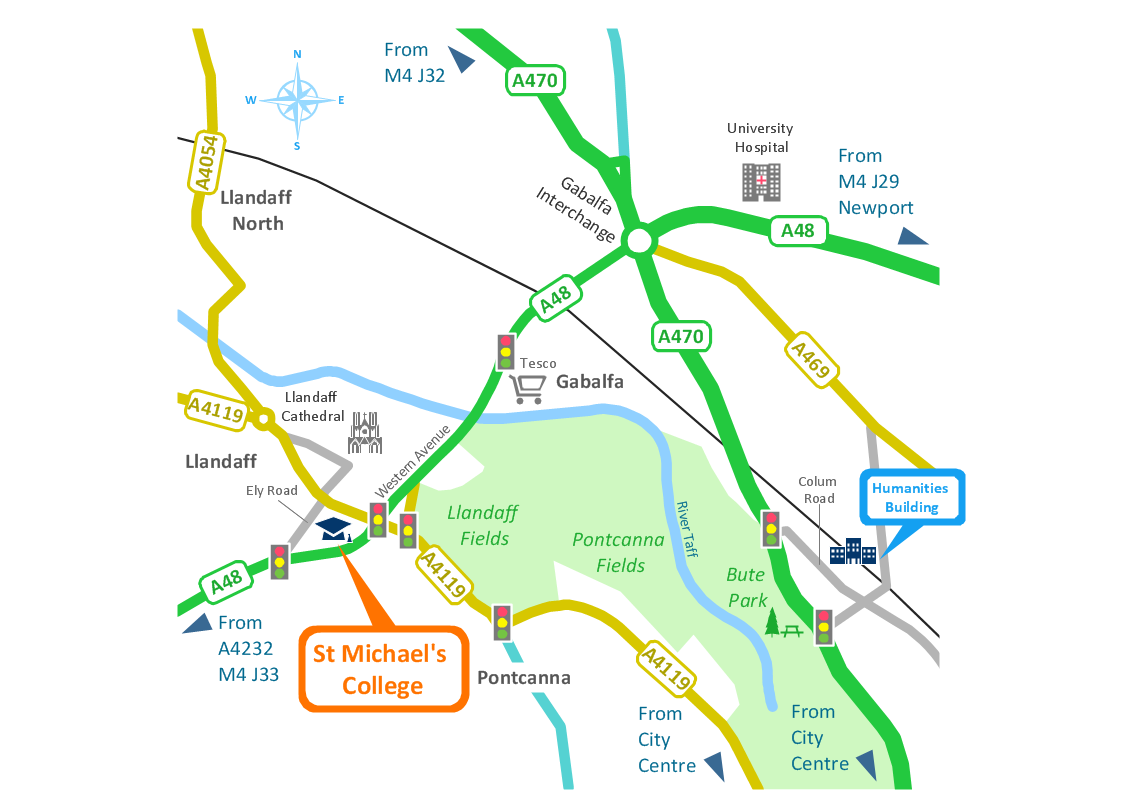
ConceptDraw PRO is a software for making infographics illustrations. You can work with various components to build really impressive and easy-to-understand infographics design.Spatial infographics Design Elements: Transport Map
Do you like infographics and data visualization? Creating infographics is super-easy with ConceptDraw.Infographics and Maps
ConceptDraw is a tool that produces colorful infographics.
 Fault Tree Analysis Diagrams
This solution extends ConceptDraw PRO v9.5 or later with templates, fault tree analysis example, samples and a library of vector design elements for drawing FTA diagrams (or negative analytical trees), cause and effect diagrams and fault tree diagrams.
How tо Represent Information Graphically
ConceptDraw Infographics is a great visual tool for communicating the large amounts of data and graphic visualization and representations of data and information.
 PM Easy
This solution extends ConceptDraw PROJECT software with the ability to quickly start a project; it lists task relationships and dependencies to make iterative planning easy.
 Event-driven Process Chain (EPC) Diagrams
Event-driven Process Chain (EPC) Diagram is a type of flowchart widely used for modeling in business engineering and reengineering, business process improvement, and analysis. EPC method was developed within the Architecture of Integrated Information Systems (ARIS) framework.
 Business Process Diagrams
The Business Process Diagram Solution extends ConceptDraw PRO v10 BPMN software with its RapidDraw interface, templates, samples, and libraries based on the BPMN 1.2 and BPMN 2.0 standards. This powerful solution permits you to visualize easily both simple and complex processes, as well as design business models. The Business Process Diagram solution allows one to quickly develop and document in detail any business processes at any stage of a project’s planning and implementation.
- How to draw Metro Map style infographics? (London) | Value Stream ...
- Data Flow Diagrams with ConceptDraw PRO | Business Diagram ...
- Spatial Infographics | How to draw Metro Map style infographics ...
- How to draw Metro Map style infographics? (London) | Metro Map ...
- Spatial Infographics | UML Class Diagram Example for Transport ...
- Fishbone Diagram | Spatial Infographics | Management |
- Entity Relationship Diagram Symbols | ERD Symbols and Meanings ...
- Continent Maps | Spatial infographics Design Elements: Continental ...
- Entity-Relationship Diagram (ERD) | ConceptDraw Solution Park ...
- SWOT Sample in Computers | Fishbone Diagram | Restaurant Floor ...
- Spatial Infographics | Total Quality Management TQM Diagrams ...
- ERD Symbols and Meanings | Entity Relationship Diagram Symbols ...
- Maps | Metro Map | Spatial Infographics |
- ConceptDraw PRO ER Diagram Tool | How to Draw a Building Plans
- ConceptDraw Solution Park | How to Draw a Flowchart | What is ...
- Maps | How to draw Metro Map style infographics? Moscow, New ...
- How To Create Emergency Plans | Why do we Need EPC Diagrams ...
- How to draw Metro Map style infographics? Moscow, New York, Los ...
- Computer and Networks | Entity-Relationship Diagram (ERD) | In ...
- How to draw Metro Map style infographics? (London) | Infographic ...
