HelpDesk
How to Draw Physics Diagrams in ConceptDraw PRO
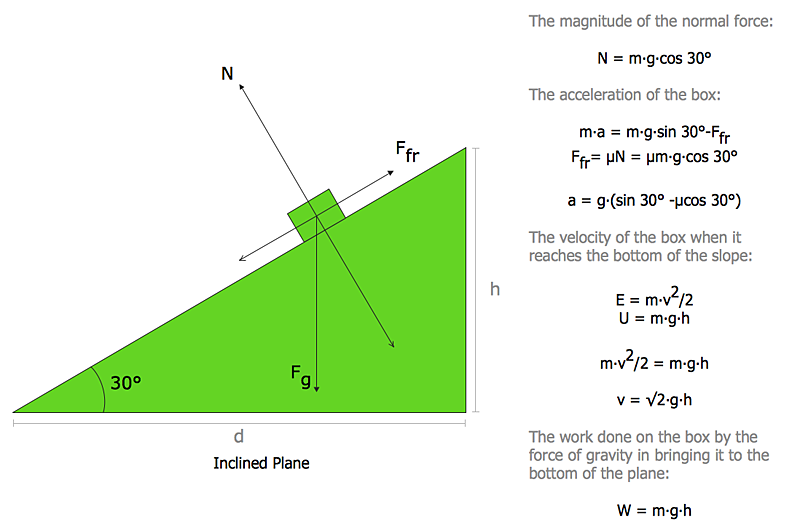
Nothing is more helpful in the study of physics as a visual representation of the physical processes: physics schemes, diagrams and illustrations. Physics charts can be helpful when you learn Physics, perform experiments, or solve any other tasks regarding Physics. ConceptDraw PRO allows you to draw physical diagrams of mechanical, nuclear, optical and electrical processes using the set of vector physics symbols and physics diagram templates.
 Physics
Physics solution extends ConceptDraw PRO software with templates, samples and libraries of vector stencils for drawing the physical illustrations, diagrams and charts.
 ConceptDraw Solution Park
ConceptDraw Solution Park collects graphic extensions, examples and learning materials
 Block Diagrams
Block diagrams solution extends ConceptDraw PRO software with templates, samples and libraries of vector stencils for drawing the block diagrams.
Process Flow Chart Symbols
Process Flow Chart is a visual diagram which shows the processes and relationships between the major components in a system, and uses for this the special process flow chart symbols: special shapes to represent different types of actions and process steps, lines and arrows to represent relationships and sequence of steps. It often named process flow diagram, it use colored flowchart symbols.It is incredibly convenient to use the ConceptDraw PRO software extended with Flowcharts Solution from the "What is a Diagram" Area of ConceptDraw Solution Park for designing professional looking Process Flow Charts.
HelpDesk
How to Draw a Circular Arrows Diagram Using ConceptDraw PRO
The cyclic recurrence is a fundamental property of multiple systems. The cycle is a process which consists from elements (phases, stages, stages) following each other. Many processes in astronomy, biology, chemistry, physics, mathematics, etc. have a cycle properties. It is also widely used in information technologies and marketing analysis. Graphical representation of cyclic processes can have many forms. It can be a circle, parabola, hyperbola, ellipse and others. A Circular Arrows Diagram is used as one of the statistical charts in the business, mass media and marketing. ConceptDraw PRO provides its users tools for making easy drawing Circular Arrows Diagrams.Flow Map
A Flow Map is a type of thinking maps which help easy organize and understand information. It consists of the set of boxes and arrows, and visually displays a sequence of events.ConceptDraw PRO diagramming and vector drawing software extended with Flowcharts Solution from the "What is a Diagram" Area of ConceptDraw Solution Park allows you to draw in a few minutes the Flow Map of any degree of complexity.
 Event-driven Process Chain Diagrams
Event-driven Process Chain (EPC) Diagram is a type of flowchart widely used for modeling in business engineering and reengineering, business process improvement, and analysis. EPC method was developed within the Architecture of Integrated Information Systems (ARIS) framework.
 Telecommunication Network Diagrams
Telecommunication Network Diagrams solution extends ConceptDraw PRO software with samples, templates and libraries of vector stencils for drawing the diagrams of telecommunication networks.
 Fault Tree Analysis Diagrams
This solution extends ConceptDraw PRO v9.5 or later with templates, fault tree analysis example, samples and a library of vector design elements for drawing FTA diagrams (or negative analytical trees), cause and effect diagrams and fault tree diagrams.
 Plumbing and Piping Plans
Plumbing and Piping Plans solution extends ConceptDraw PRO v10.2.2 software with samples, templates and libraries of pipes, plumbing, and valves design elements for developing of water and plumbing systems, and for drawing Plumbing plan, Piping plan, PVC Pipe plan, PVC Pipe furniture plan, Plumbing layout plan, Plumbing floor plan, Half pipe plans, Pipe bender plans.
 Seating Plans
The correct and convenient arrangement of tables, chairs and other furniture in auditoriums, theaters, cinemas, banquet halls, restaurants, and many other premises and buildings which accommodate large quantity of people, has great value and in many cases requires drawing detailed plans. The Seating Plans Solution is specially developed for their easy construction.
 Entity-Relationship Diagram (ERD)
An Entity-Relationship Diagram (ERD) is a visual presentation of entities and relationships. That type of diagrams is often used in the semi-structured or unstructured data in databases and information systems. At first glance ERD is similar to a flowch
 Rack Diagrams
Rack Diagrams solution extends ConceptDraw PRO software with samples, templates and libraries of vector stencils for drawing the computer network server rack mounting diagrams.
- How To Draw A Vector Diagram Engineering Science
- Physics | Physics Diagrams | Block diagram - Porter's five forces ...
- How to Draw Physics Diagrams in ConceptDraw PRO | Simple Flow ...
- Hybrid Network Topology | How to Draw Physics Diagrams in ...
- How To Draw Educational Diagram
- Free-body diagram | How to Draw Physics Diagrams in ...
- How to Draw Physics Diagrams in ConceptDraw PRO | Physics ...
- Physics Diagrams | How to Draw Physics Diagrams in ConceptDraw ...
- Simple Flow Chart | LLNL Flow Charts | How to Draw Physics ...
- How to Draw Physics Diagrams in ConceptDraw PRO | Physics ...
- How To Draw Vector Diagram In Electrical Science
- Cisco Optical. Cisco icons, shapes, stencils and symbols | Physics ...
- Free-body diagram | Physics Diagrams | How to Draw Physics ...
- Process Flowchart | Flow Map | Physics Symbols | Draw Five Types ...
- Physics Diagrams | How to Draw Physics Diagrams in ConceptDraw ...
- Active Directory Diagram | Fault Tree Analysis Diagrams | Physics ...
- Draw The Diagram On Science
- Block Diagram Creator | Process Flowchart | Functional Block ...
- Physics Diagrams | Entity Relationship Diagram - ERD - Software for ...
- Types of Flowcharts | Cause and Effect Analysis | Block Diagram ...


