HelpDesk
How to Draw a Decision-Making Diagram
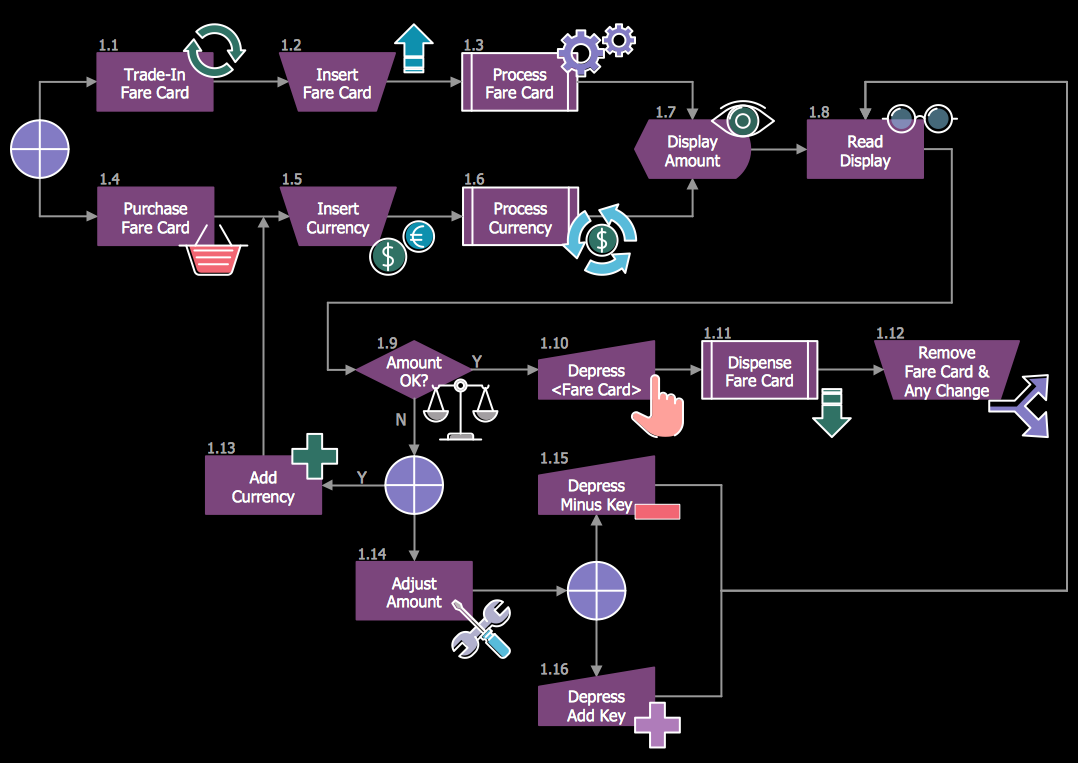
The Decision-Making solution provides ConceptDraw DIAGRAM users with vector libraries, containing a full set of flowchart symbols. Also, it offers a number of templates and samples, making short work of creating a graphical view of decision-making processes.
 Decision Making
The Decision Making solution offers the set of professionally developed examples, powerful drawing tools and a wide range of libraries with specific ready-made vector decision icons, decision pictograms, decision flowchart elements, decision tree icons, decision signs arrows, and callouts, allowing the decision maker (even without drawing and design skills) to easily construct Decision diagrams, Business decision maps, Decision flowcharts, Decision trees, Decision matrix, T Chart, Influence diagrams, which are powerful in questions of decision making, holding decision tree analysis and Analytic Hierarchy Process (AHP), visual decomposition the decision problem into hierarchy of easily comprehensible sub-problems and solving them without any efforts.
Pyramid Diagram
Pyramid diagram is a chart used to visualize the data in a hierarchical (pyramid-like) structure and depict the foundation-based relationships. Pyramid diagram looks like a triangle divided by lines into several sections (layers) and can be oriented up or down, and represented in 2D or 3D view. 2D Pyramid diagrams are a great way to illustrate the hierarchical structure, 3D Pyramids are equally good to represent the class stratification and hierarchy. ConceptDraw DIAGRAM diagramming and vector drawing software with included Pyramid Diagrams solution from Marketing area of ConceptDraw Solution Park is a powerful application which contains templates and library of vector design elements for instantly drawing three level Pyramid model, four level and five level Triangle charts. All predesigned objects are easy for changing color style and resizing according to your needs, and ConceptDraw documents with Pyramid diagrams can be easy exported in various formats for further using in marketing presentations, for effective analyzing hierarchy levels and illustration your data and ideas.Marketing Flow Chart
ConceptDraw DIAGRAM diagramming and vector drawing software extended with Marketing Diagrams Solution from the Marketing Area of ConceptDraw Solution Park is the best software for quick and easy creating Marketing Flow Chart of any complexity and design. This charts created to define marketing project stages. In small business project management it sometimes generated by simple marketing project management software. Here is samples which included in Marketing Area of ConceptDraw Solution Park and it can be used as for project planning software as for project management report.HelpDesk
How to Create an Enterprise Architecture Diagram
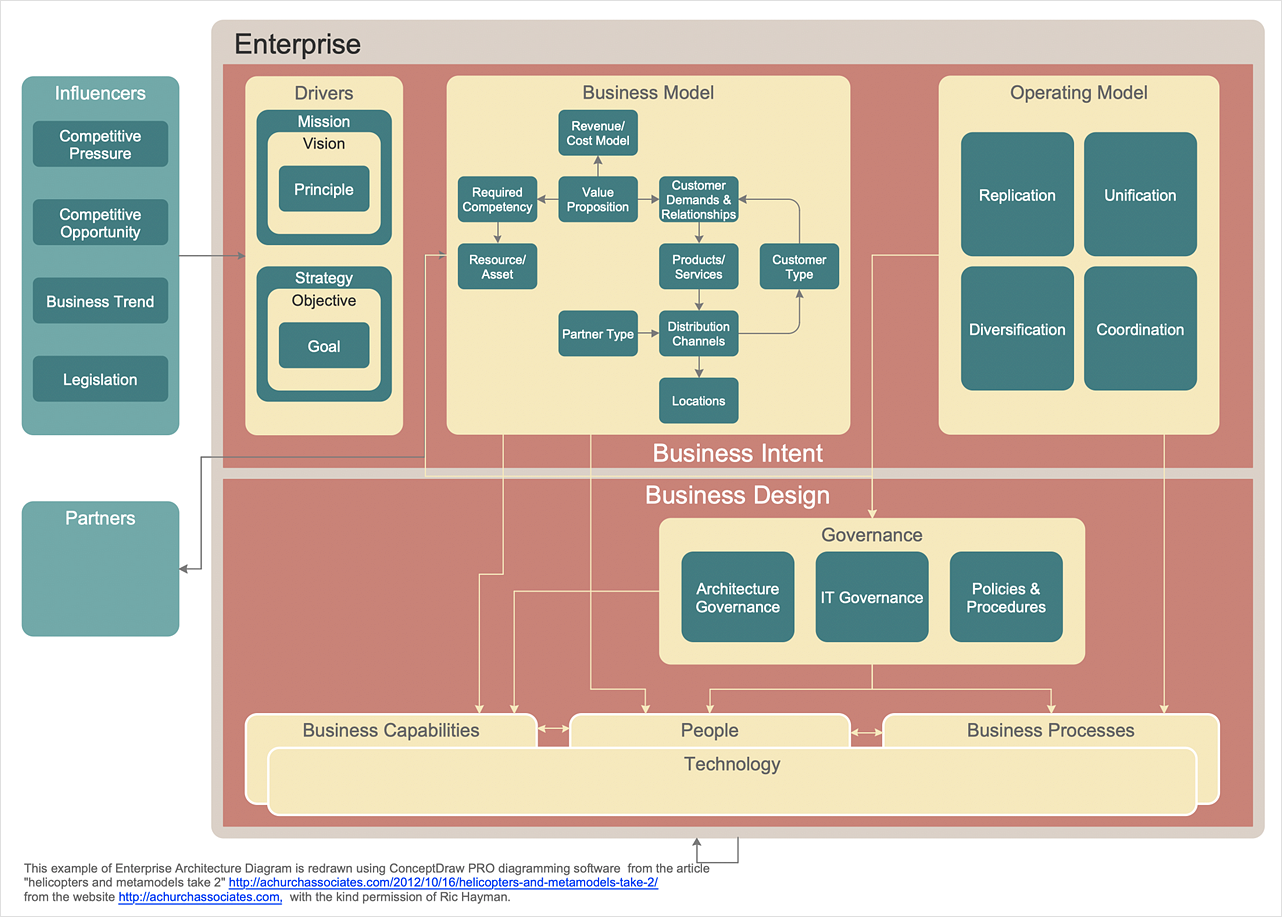
An Enterprise Architecture (EA) diagram is used to display the structure and operations of an organization. It is used to analyze and document an organization and its business functions, along with the applications and systems on which they are implemented. The aim of an enterprise architecture diagram is to determine how an organization can effectively achieve its current and future objectives. The Enterprise Architecture often uses diagrams to support the decision-making process. ConceptDraw DIAGRAM allows you to design Enterprise Architecture diagrams of any complexity.HelpDesk
How to Draw a Matrix Organizational Chart
There are a number of moments which are influenced on how the organizational structure of a certain business needs to be, how complex, and which type it should keep. The matrix organizational structure is atypical because it brings together employees and managers from different departments to work toward accomplishing a goal. This structure is commonly found in businesses that have more than one line of reportage. For instance, a company might contain an engineering department with engineering managers who workers report to. However, these workers might also have to liaise with different product or project managers depending on current tasks. Some form of matrix organization is found in most large-scale modern businesses. It is one of the most complicated reporting structures. You can easily build a clear matrix organizational chart in ConceptDraw DIAGRAM using templates from ConceptDraw Solution Park.Influence Diagram
This sample shows the Influence Diagram. It was created in ConceptDraw DIAGRAM diagramming and vector drawing software using the Basic Diagramming Solution from the Universal Diagramming area of ConceptDraw Solution Park. Influence diagram represents the directed acyclic graph with three types of nodes and three types of arcs that connect the nodes. Decision node is drawn as a rectangle, Uncertainty node is drawn as an oval, Value node is drawn as an octagon.How To Make the Right Decision in Projects
A key point of conference success is the ability to see slides in real time, and hold documented discussions during the meeting. Remote Presentation for Skype is a new solution allows real-time presenting that benefits work groups who need collaborate by web meetings.
Organizational Structure
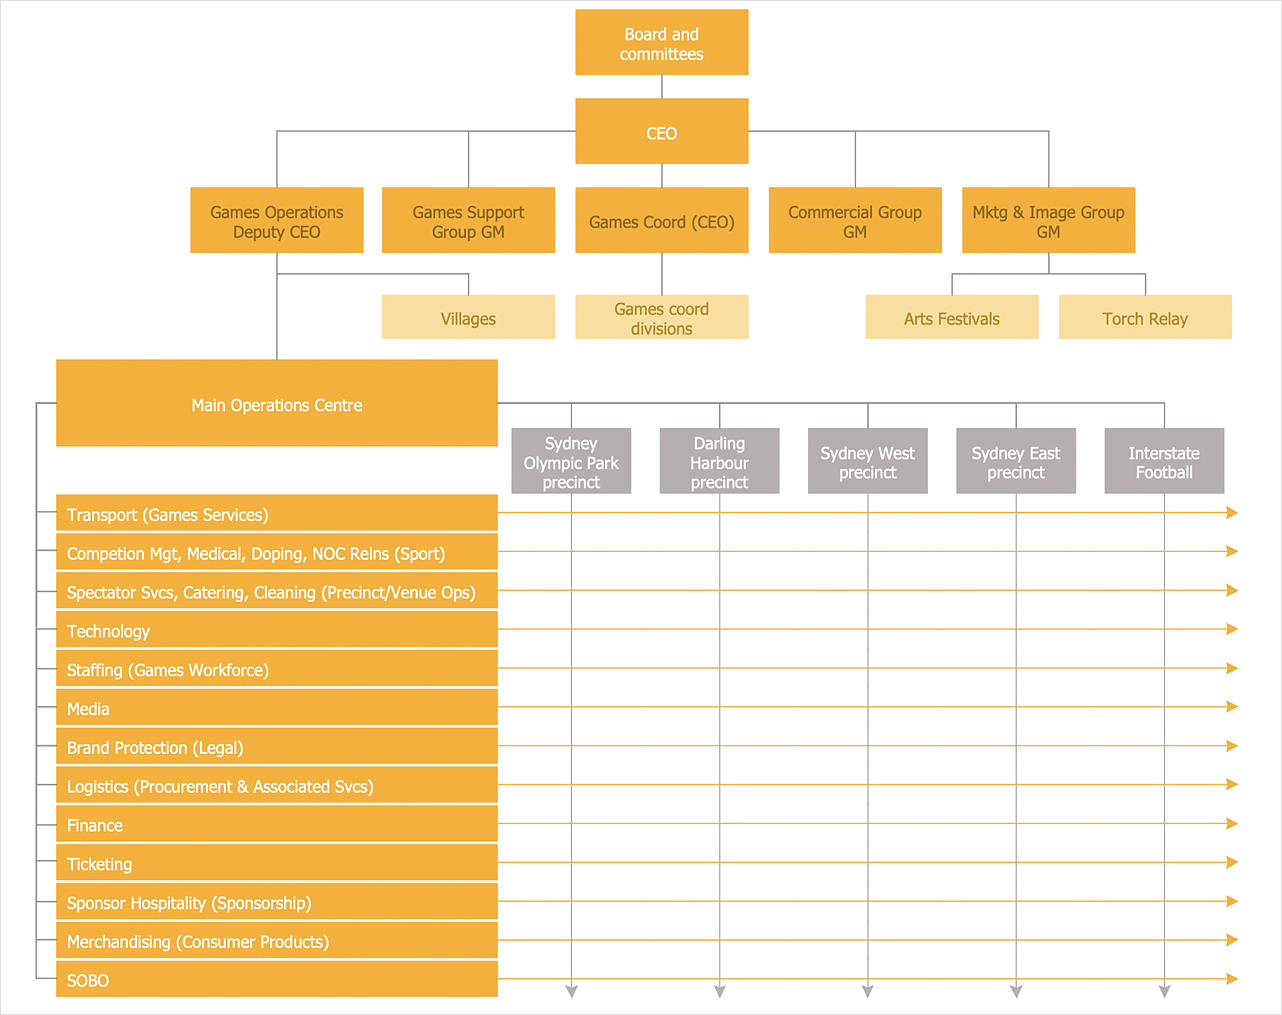
The organizational structure reflects the composition and hierarchy of company's divisions, determines the distribution of authorities and responsibilities within the organization, and facilitates the understanding by workers their responsibilities. It also defines the group of people making key decisions at the company. Visualization of organizational structure of any company, organization or institution is not an easy task, because sometimes the company may include several departments, each with more than thousand persons. For such large organizations often are created the Organizational charts for every department separately. There are many ways of organization's structuring, which determine its work. Often happens that organizational structure adapts to production process. ConceptDraw DIAGRAM extended with unique Organizational Charts solution from Management area of ConceptDraw Solution Park is a powerful organizational structure software, which ideally suits for developing Organizational Charts of any type and any complexity.Audit Flowchart Symbols
The audit is a complex process consisting of defined quantity of steps, which have as a final goal the ensuring of success of a certain business project. It includes the independent examination of data, statements and financial performances of an enterprise for a stated purpose. It is convenient to construct the Audit Flowcharts or Audit Diagrams for visual representation and structuring the audit processes. ConceptDraw DIAGRAM diagramming software enhanced with Audit Flowcharts solution from the Finance and Accounting area of ConceptDraw Solution Park effectively helps to draw the Audit Diagrams for accounting, finance and money management, the Audit Flowcharts for fiscal information tracking, financial inventories and documenting Six Sigma, the decision making Flow Charts, etc. This solution provides the powerful drawing tools, numerous templates and samples, and large quantity of vector audit flowchart symbols that greatly facilitate the process of representation the audit steps and audit results, and designing efficient and visually appealing Audit Flowcharts.- Block diagram - Customer decision making | How to Draw Business ...
- A Diagram Example To Describe A Decision Making Process
- Diagram Of Decision Making Process
- Purchasing Decision Making Process Block Diagram
- Flowchart On Decision Making Process Of Buying Mobile Phone
- How to Draw a Decision - Making Diagram | Decision Making ...
- Online Decision Making Process Block Diagrams
- With Aid Of Diagram Illustrate The Stages Of Decision Making In Mis
- Decision Making | Derivative works decision tree | Influence ...
- Marketing Diagrams | Consumer Decision Making Process Diagrams


