How To Draw a Diagram
Is it possible to draw a diagram as quickly as the ideas come to you? The innovative ConceptDraw Arrows10 Technology included in ConceptDraw DIAGRAM is a simple and powerful tool to create any type of diagram. You mau choose to start from one of plenty diagram templates or to use your own idea.Geo Map - Africa - Algeria
Algeria, officially The People's Democratic Republic of Algeria, is a country in the Maghreb region of North Africa on the Mediterranean coast. The vector stencils library Algeria contains contours for ConceptDraw DIAGRAM diagramming and vector drawing software. This library is contained in the Continent Maps solution from Maps area of ConceptDraw Solution Park.How To Make a Bubble Chart
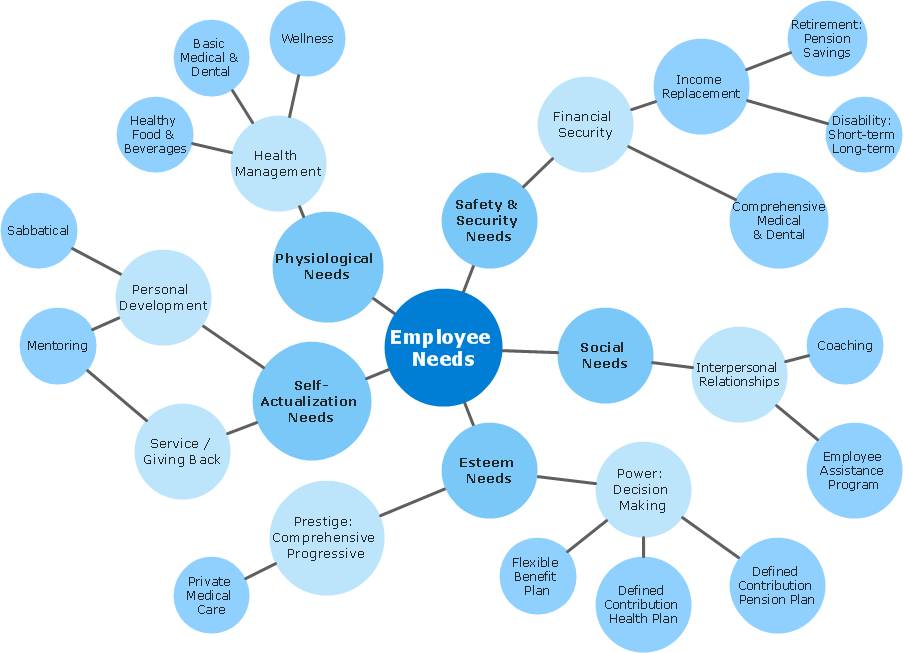
Bubble diagrams solution extends ConceptDraw DIAGRAM software with templates, Using ConceptDraw Connectors, you can make a bubble chart in moments. Using ConceptDraw you will be able to make a bubble chart from the ready ConceptDraw library objects or make your own objects. The created diagram can represent ideas organization, in brainstorming processes, by teachers for explaining difficult ideas or for presentations.Draw Diagram on Mac
Professional diagramming software for mac helps you create Cause and Effect diagram known as Fishbone diagram or Ishikawa diagram from ConceptDraw Business Solution. You will be offered to use templates, samples or draw your diagram using ConceptDraw Arrows10 TechnologyConceptDraw Arrows10 Technology
Auto-connection mode - This is more than enough versatility to draw any type of diagram with any degree of complexity. How should diagramming software work? Is it possible to develop a diagram as quickly as the ideas come to you? The innovative Auto-connection mode is what you need to start draw.Create Block Diagram
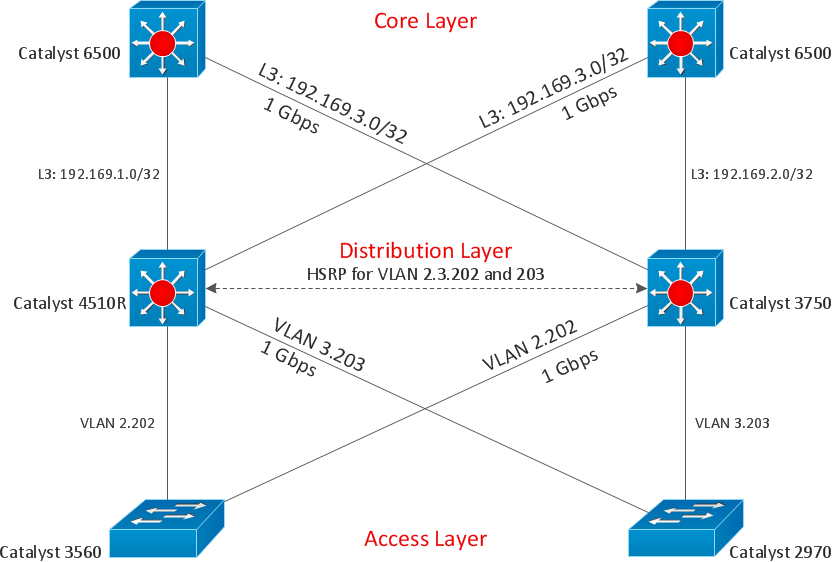
Block diagrams solution extends ConceptDraw DIAGRAM software with templates, samples and libraries of vector stencils for creating the block diagram. Create block diagrams, electrical circuit diagrams, schematics, and more in minutes with ConceptDraw DIAGRAM.Event-Driven Process Chain Diagram Software
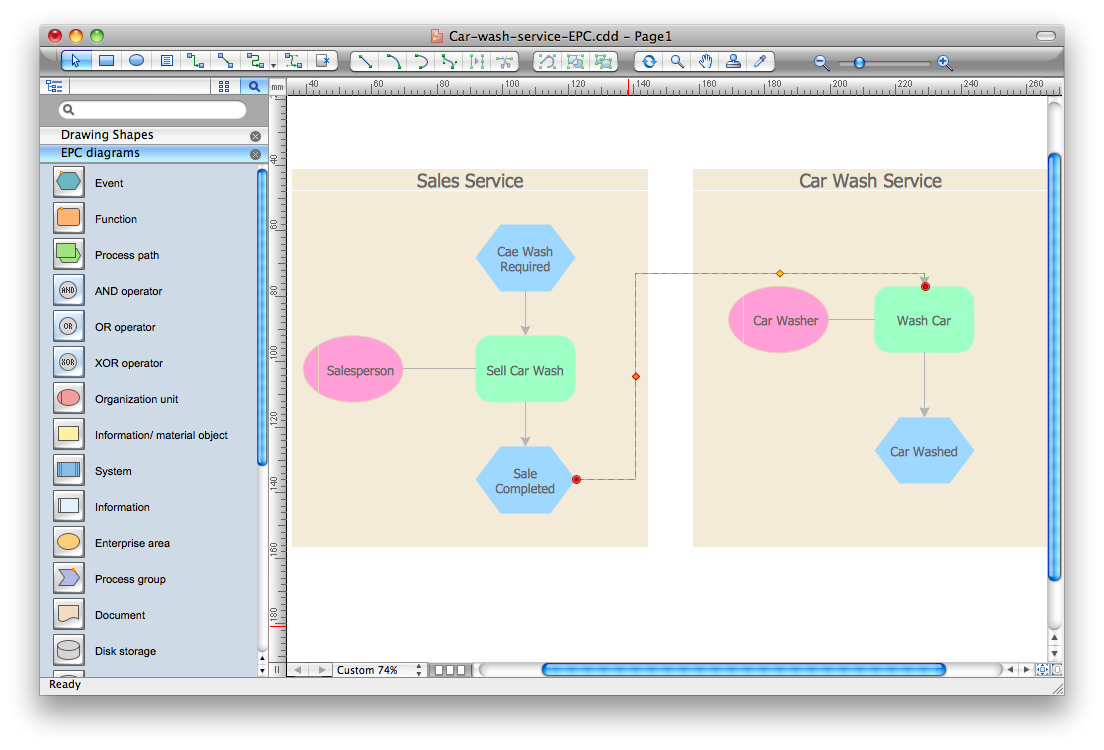
It’s very easy, quick and convenient to draw the Event-driven Process Chain (EPC) diagrams in ConceptDraw DIAGRAM diagramming and vector drawing software using the Event-driven Process Chain Diagrams Solution from the Business Processes area of ConceptDraw Solution Park.ConceptDraw DIAGRAM - Organizational chart software
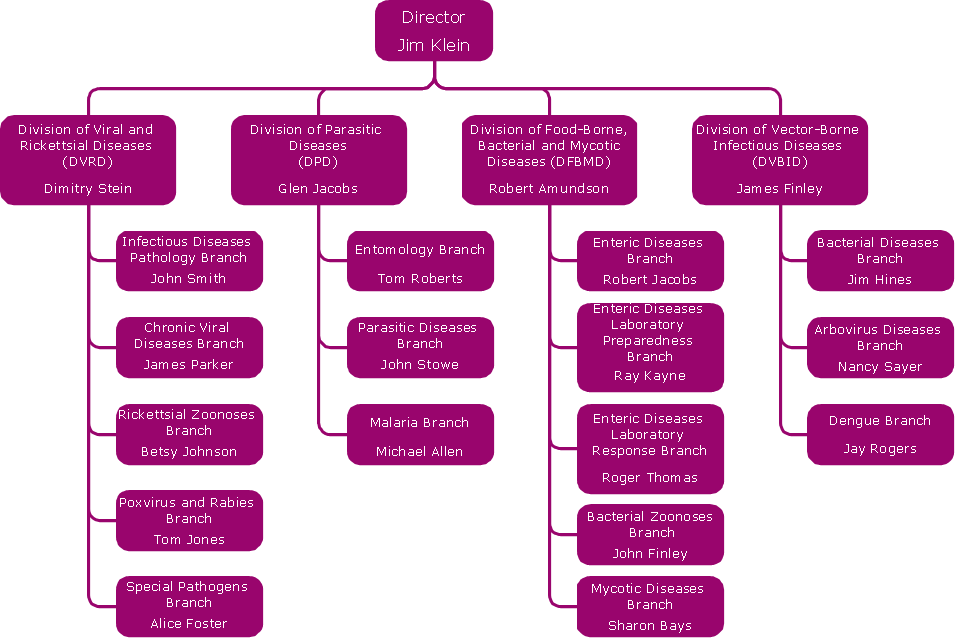
Organizational Chart is a scheme which visualizes the composition of departments, sectors and other functional units of an organization, and also fixed relationships that exist between divisions and employees. ConceptDraw DIAGRAM enhanced with Organizational Charts solution is a powerful and cost effective Organizational chart software, which allows to automate the process of creation the high standard organizational charts, flow charts, time lines, and much more diagrams. It can be applied for analyzing organizational structure and drawing single or multi-page Organizational Charts with hyperlinks for the companies of any type, size and direction. Visualize the structure using the orgchartal tools, create easily as never before the Company Organizational Chart, Corporate Organizational Chart, Hospital Organizational Chart, University Organizational Chart, Hotel Organizational Chart, and then export, send by e-mail or publish it on Web in minutes, to communicate and discuss with colleagues or any other interested people.Create Organizational Chart
ConceptDraw DIAGRAM software is greatly powerful in many fields due to the large collection of provided solutions by ConceptDraw Solution Park, among them the cost effective Organizational Chart design capabilities. Organizational Charts Solution from the Management Area of ConceptDraw Solution Park perfectly suits for analyzing the organizational structures, visualizing and designing Organizational Charts for the companies of any sizes, for creation the hotel organizational chart, hospital organizational chart, corporate organizational chart, different flow charts, time lines, and much more. Organizational Charts Solution makes ConceptDraw DIAGRAM the perfect analyzer tool for managers and administrative staff. It offers plenty of useful and convenient tools for ConceptDraw DIAGRAM users, including the set of Organizational chart templates that make the process of creation Organizational Charts on their base easier and quicker, extensive Organizational chart library of tasks-specific symbols and shapes, helpful Organizational chart examples and samples.Organogram Software
Organizing process is the process of creating the organizational structure of an enterprise. The organizing process consists of several stages. First, you need to divide the organization into departments, respectively to strategies, and then establish relationships of authority. After that, managing director delegates his rights and authorities.- How To Draw a Diagram | Organizational Charts | Geo Map - Africa ...
- How To Draw a Diagram | Geo Map - Africa - Algeria | ConceptDraw ...
- Geo Map - South America Continent | How to Draw a Map of North ...
- Basic Diagramming | Mathematics | Draw Company Structure with ...
- How To Draw a Diagram | How to Draw an Organization Chart ...
- Orgchart | Business Diagram Software | How to Draw an ...
- Transport map template | Maps | Rail transport - Vector stencils ...
- Why do we Need EPC Diagrams | ConceptDraw PRO | How to Use ...
- How to Draw a Сonstellation Сhart | How to Create Education ...
- How to Draw an Organization Chart | Orgchart | Organizational Chart ...
- Rapid UML | Business Productivity Area | Risk diagram - Chronic ...
- How to Draw an Organizational Chart Using ConceptDraw PRO ...
- LLNL Flow Charts | USA Maps | Forces shaping the broadband ...
- Cross Functional Flowchart for Business Process Mapping | Process ...
- Fruit and vegetables consumption infogram | Healthy Diet Plan | Fast ...
- Orgchart | How to Create Organizational Chart Quickly ...
- Typical Drawing Of Small Medium And Large Organizational Chart
- Swim Lane Diagrams | IDEF3 Standard | Work Order Process ...
- Normal (Gaussian) distribution graph | Frequency Distribution ...
- Growth Pictures To Draw
