HelpDesk
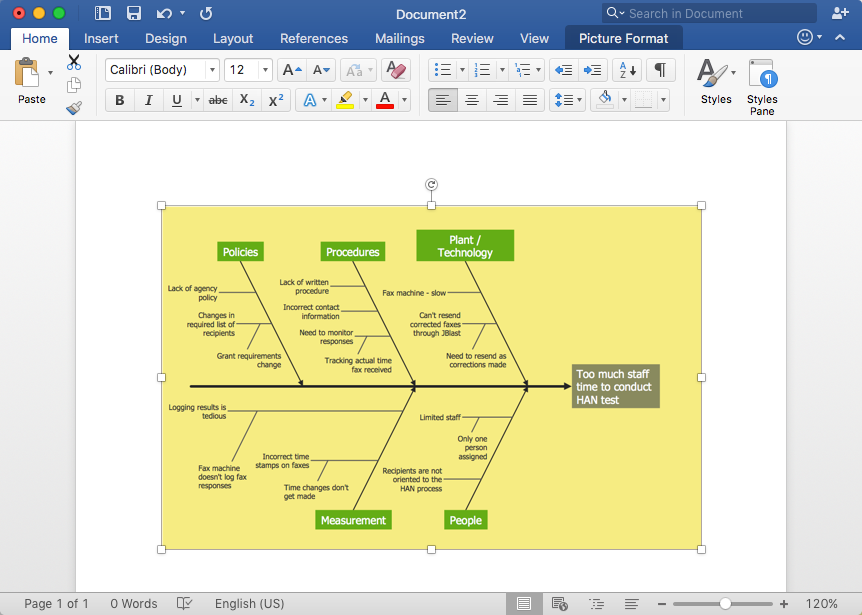
How to Add a Fishbone (Ishikawa) Diagram to an MS Word Document
The ability to create a fishbone (Ishikawa) Diagram is supported by the ConceptDraw Fishbone Diagram solution. ConceptDraw DIAGRAM allows you to easily create a fishbone diagrams and then insert them into a MS Word document.In searching of alternative to MS Visio for MAC and PC with ConceptDraw DIAGRAM
Undoubtedly MS Visio is a powerful and multifunctional tool, but however at times occur the instances, when it turns unable of meeting certain users' requirements. At this cases you may need to use an alternative program software, preferably it will be simple, convenient, and at the same time powerful and professional. In searching the alternative to MS Visio for MAC and PC we recommend you to pay attention for ConceptDraw DIAGRAM software, which was developed to satisfy all your drawing needs and requirements. It is a fully-functioned alternative product to MS Visio for both platforms. ConceptDraw DIAGRAM software has many advantages, the main among them are the cross-platform compatibility, a reasonable price, widespread ConceptDraw Solution Park with huge variety of different solutions that offer numerous libraries of specialized vector objects, useful examples, samples, and quick-start templates, extensive import / export capabilities, built-in script language, MS Visio support and certainly free technical support.
 Fishbone Diagram
Fishbone Diagrams solution extends ConceptDraw DIAGRAM software with templates, samples and library of vector stencils for drawing the Ishikawa diagrams for cause and effect analysis.
 Fishbone Diagrams
The Fishbone Diagrams solution extends ConceptDraw DIAGRAM software with the ability to easily draw the Fishbone Diagrams (Ishikawa Diagrams) to clearly see the cause and effect analysis and also problem solving. The vector graphic diagrams produced using this solution can be used in whitepapers, presentations, datasheets, posters, and published technical material.
HelpDesk
How to Draw a Pyramid Diagram
Pyramid diagram (triangle diagram) is used to represent data, which have hierarchy and basics. Due to the triangular form of the diagram, each pyramid section has a different width. The width of the segment shows the level of its hierarchy. Typically, the top of the pyramid is the data that are more important than the base data. A pyramid scheme can be used to show proportional and hierarchical relationships between some logically related items, such as departments within an organization, or successive elements of any process. This type of diagram is often used in marketing to display hierarchically related data, but it can be used in a variety of situations. ConceptDraw DIAGRAM allows you to make a pyramid diagram, quickly and easily using special libraries.
 Word Exchange
This solution extends ConceptDraw MINDMAP software with the ability to quickly create the framework for a future article or book, fill the structure with ideas, and use it to produce an MS Word document with just a simple click of the mouse.
 Enterprise Architecture Diagrams
Enterprise Architecture Diagrams solution extends ConceptDraw DIAGRAM software with templates, samples and library of vector stencils for drawing the diagrams of enterprise architecture models.
 IDEF0 Diagrams
IDEF0 Diagrams visualize system models using the Integration Definition for Function Modeling (IDEF) methodology. Use them for analysis, development and integration of information and software systems, and business process modelling.
- How to Add a Fishbone ( Ishikawa ) Diagram to a MS Word Document ...
- How To Draw Block Diagram In Word
- How to Add a Fishbone ( Ishikawa ) Diagram to a MS Word Document ...
- Draw Fishbone Diagram on MAC Software | Fishbone Diagram ...
- Draw Fishbone Diagram on MAC Software | How to Make SWOT ...
- Fishbone Diagram | Draw Fishbone Diagram on MAC Software ...
- How To Draw Fault Tree In Word
- Draw Fishbone Diagram on MAC Software | Fishbone Diagram ...
- How to Add a Fishbone ( Ishikawa ) Diagram to a MS Word Document ...
- How to Add a Fishbone ( Ishikawa ) Diagram to a MS Word Document ...
- Draw Fishbone Diagram on MAC Software | How To Create a MS ...
- Fishbone Diagram | Draw Fishbone Diagram on MAC Software ...
- Fishbone Diagrams | Example of DFD for Online Store (Data Flow ...
- Draw Fishbone Diagram on MAC Software | Cause and Effect ...
- How to Add a Fishbone ( Ishikawa ) Diagram to a MS Word Document ...
- Line Chart Template for Word | Draw Fishbone Diagram on MAC ...
- Fishbone Diagram | Fishbone Diagram Template | Draw Fishbone ...
- Fishbone Diagrams | Cause and Effect Analysis | Café Floor Plan ...
- How to Create a Fishbone ( Ishikawa ) Diagram Quickly | Fishbone ...
- Fishbone Diagram | Fishbone Diagrams | How To Create a MS Visio ...


