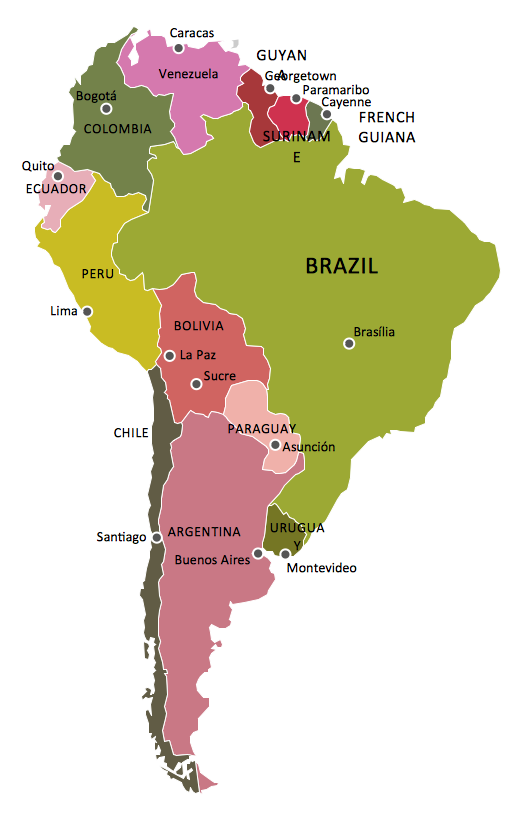
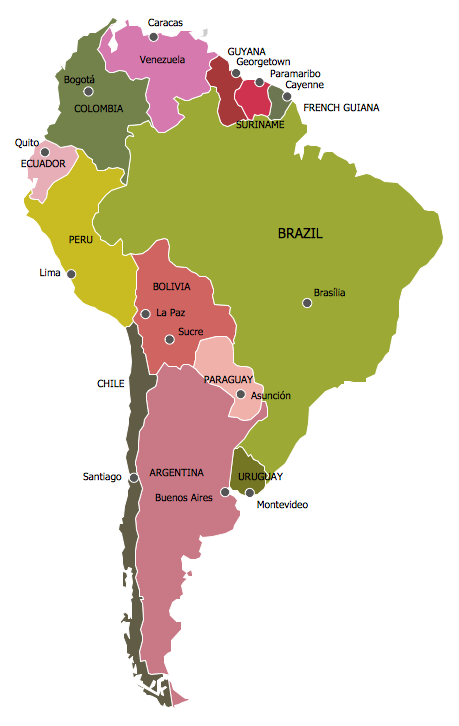
Geo Map — South America Continent
South America includes 12 sovereign states. ConceptDraw DIAGRAM is idea to draw the geological maps of South America continent from the pre-designed vector geo map shapes. Use Continent Maps solution from the Maps area of ConceptDraw Solution Park to draw thematic maps, geospatial infographics and vector illustrations for your business documents, presentations and websites.Geo Map - South America - Panama
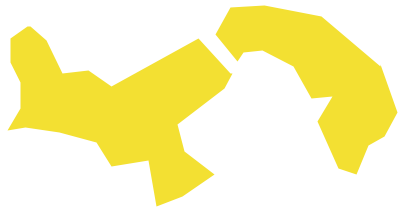
Panama, officially Republic of Panama, is the southernmost country of Central America and the whole of North America. The vector stencils library Panama contains contours for ConceptDraw DIAGRAM diagramming and vector drawing software. This library is contained in the Continent Maps solution from Maps area of ConceptDraw Solution Park.Map of Continents
A continent is one of several very large landmasses on Earth. ConceptDraw DIAGRAM diagramming and vector drawing software offers the unique Continent Maps Solution from the Maps Area which is indispensable for drawing the map of continents of the Earth.
 Continent Maps
Continent Maps solution extends ConceptDraw DIAGRAM software with templates, samples and libraries of vector stencils for drawing the thematic maps of continents, state maps of USA and Australia.
"A thematic map is a type of map or chart especially designed to show a particular theme connected with a specific geographic area. ...
A thematic map is a map that focuses on a specific theme or subject area, whereas in a general map the variety of phenomena - geological, geographical, political - regularly appear together. ...
Thematic maps emphasize spatial variation of one or a small number of geographic distributions. These distributions may be physical phenomena such as climate or human characteristics such as population density and health issues. ...
Thematic map are sometimes referred to as graphic essays that portray spatial variations and interrelationships of geographical distributions. Location, of course, is important to provide a reference base of where selected phenomena are occurring. ...
Thematic maps serve three primary purposes.
First, they provide specific information about particular locations.
Second, they provide general information about spatial patterns.
Third, they can be used to compare patterns on two or more maps." [Thematic map. Wikipedia]
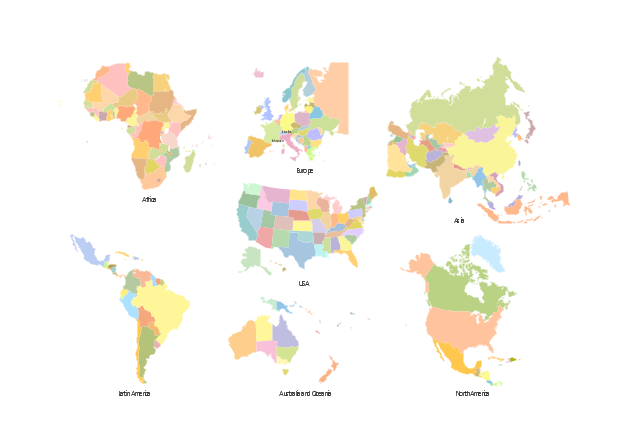
The vector stencils library "Thematic maps" contains 7 continent map contours for creating the thematic maps of geographic regions displaying the metric values by countries, states and territories marked by different colors.
Use the design elements library "Thematic maps" to create spatial dashboards using the ConceptDraw PRO diagramming and vector drawing software for your Spatial Intelligence and Location Intelligence business practice.
The example "Design elements - Thematic maps" is included in the Spatial Dashboard solution from the area "What is a Dashboard" of ConceptDraw Solution Park.
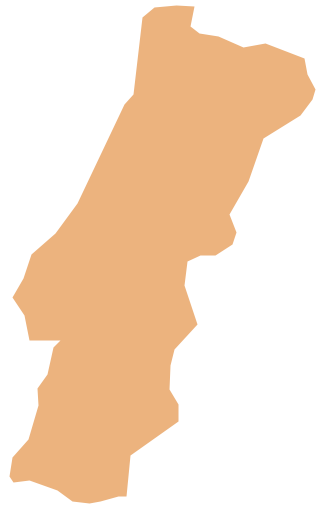
Geo Map - Europe - Portugal
The vector stencils library Portugal contains contours for ConceptDraw DIAGRAM diagramming and vector drawing software. This library is contained in the Continent Maps solution from Maps area of ConceptDraw Solution Park.Geo Map - Africa
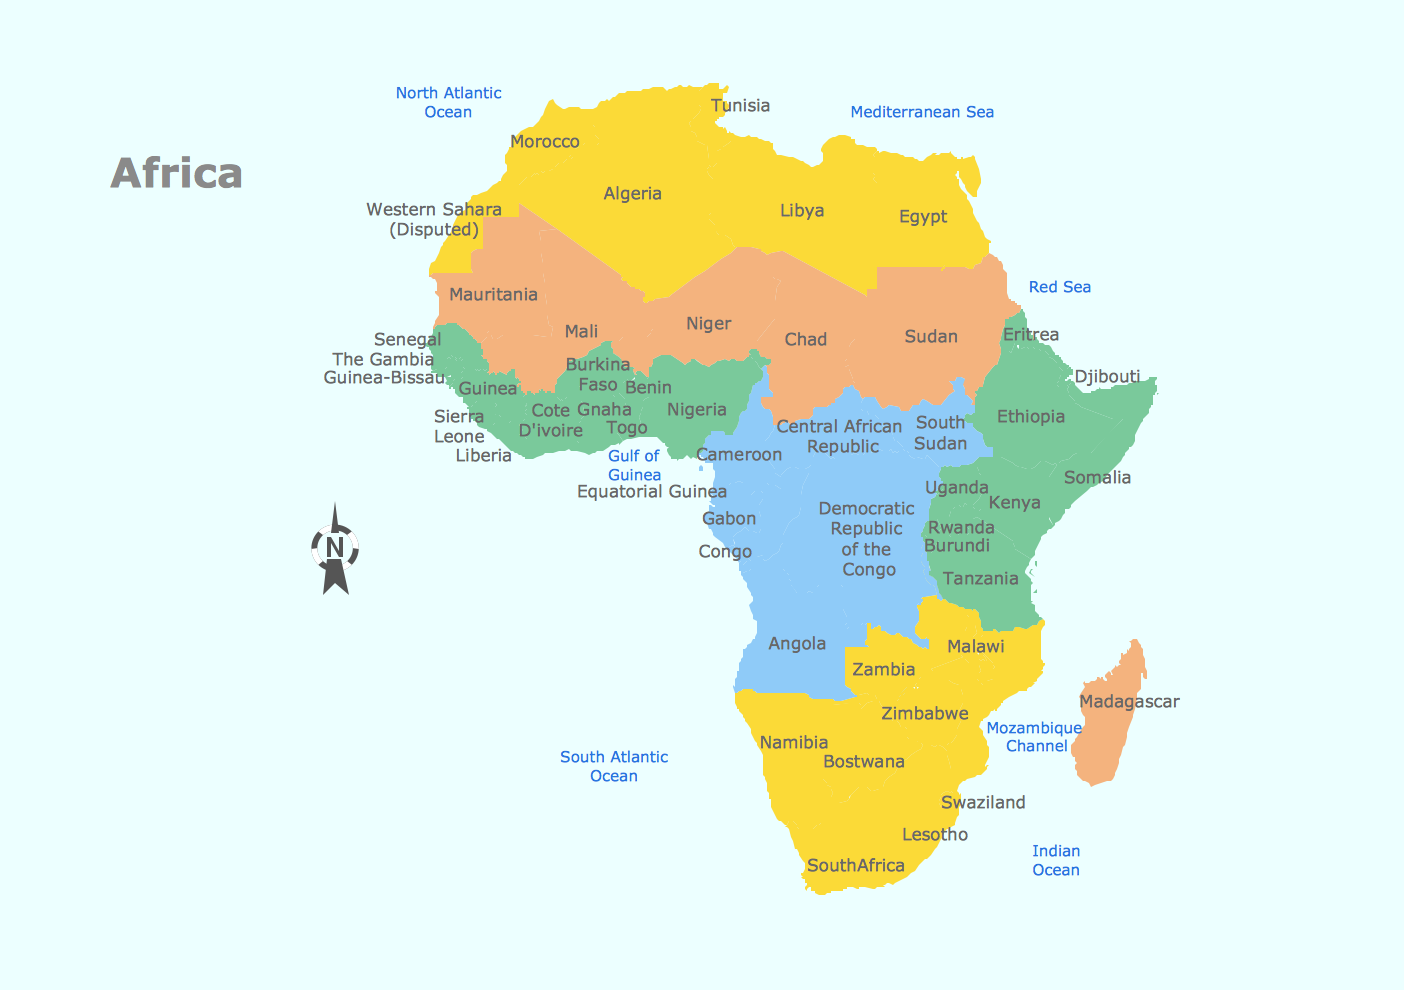
Africa has 54 fully recognized sovereign states, 9 territories and two de facto independent states with limited or no recognition. Vector design elements library Africa contains country map contours, geographical maps, cartograms and thematic maps for ConceptDraw DIAGRAM diagramming and vector drawing software. To help visualize the business and thematic information connected with geographic areas, locations or customs. All ConceptDraw DIAGRAM documents are vector graphic files and are available for reviewing, modifying, and converting to a variety of formats: image, HTML, PDF file, MS PowerPoint Presentation, Adobe Flash, MS Visio (.VDX,.VSDX).Cross-Functional Flowchart (Swim Lanes)
Cross-Functional Flowchart is a type of chart which shows the series of process steps connected by the arrows to depict their order and applies the swim lanes to provide an extra dimension with means of assigning each process step to certain category. Often the category or the functional unit is a stakeholder (department, person, role), resource, project, phase, or any other attribute. Cross-Functional Flowcharts visually illustrate relationships between the business processes and the functional units responsible for this processes. ConceptDraw DIAGRAM is a powerful diagramming and vector drawing software for professional design Cross-Functional Flowcharts using the common notation of shapes and swim lanes. Cross-Functional Flowcharts solution included to the Business Processes area of ConceptDraw Solution Park provides numerous well-designed vector objects and connector tools for quick, easy and effective organizing information, representing process flows and relationships, and drawing Cross-Functional Flowcharts for business, science, education, technology, etc.Spatial infographics Design Elements: Continental Map
ConceptDraw DIAGRAM is a software for making infographics illustrations. You can work with various components to build really impressive and easy-to-understand infographics design.3 Circle Venn. Venn Diagram Example
This example shows the 3 Circle Venn Diagram. The Venn Diagrams visualize all possible logical intersections between several sets. On this example you can see the intersections of 3 sets. Venn Diagrams are widely used in mathematics, logic, statistics, marketing, sociology, etc.- Latin Europe
- South America regions - Political map | Geo Map - Asia - Papua New ...
- Geo Map - United States of America Map | North America map with ...
- Thematic maps - Vector stencils library | North America map ...
- North America map with capitals - Template | Geo Map - United ...
- South America regions - Political map | Political map of Central ...
- North America Thematic Map
- Geo Map of Americas | Geo Map - South America - Peru | Geo ...
- Languages of South America - Thematic map | North America map ...
- North America map - Template | North America - Vector stencils ...
- Political map of Central America
- Geo Map — United States of America Map | North America map with ...
- Design elements - Thematic maps | Geo Map - South America ...
- Geo Map - United States of America Map | Andean states - Political ...
- Geography - Vector stencils library | Geo Map - South America ...
- Design elements - North and Central America country flags | North ...
- Geo Map — South America Continent | Geo Map - USA ...
- Continent Maps | South America regions - Political map | Benefit ...
- United States of America - Vector stencils library | Map of USA with ...
