Process Flowchart
The main reason of using Process Flowchart or PFD is to show relations between major parts of the system. Process Flowcharts are used in process engineering and chemical industry where there is a requirement of depicting relationships between major components only and not include minor parts. Process Flowcharts for single unit or multiple units differ in their structure and implementation. ConceptDraw PRO is Professional business process mapping software for making Process flowcharts, Process flow diagram, Workflow diagram, flowcharts and technical illustrations for business documents and also comprehensive visio for mac application. Easier define and document basic work and data flows, financial, production and quality management processes to increase efficiency of your business with ConcepDraw PRO. Business process mapping software with Flowchart Maker ConceptDraw PRO includes extensive drawing tools, rich examples and templates, process flowchart symbols and shape libraries, smart connectors that allow you create the flowcharts of complex processes, process flow diagrams, procedures and information exchange. Process Flowchart Solution is project management workflow tools which is part ConceptDraw Project marketing project management software. Drawing charts, diagrams, and network layouts has long been the monopoly of Microsoft Visio, making Mac users to struggle when needing such visio alternative like visio for mac, it requires only to view features, make a minor edit to, or print a diagram or chart. Thankfully to MS Visio alternative like ConceptDraw PRO software, this is cross-platform charting and business process management tool, now visio alternative for making sort of visio diagram is not a problem anymore however many people still name it business process visio tools.
HelpDesk
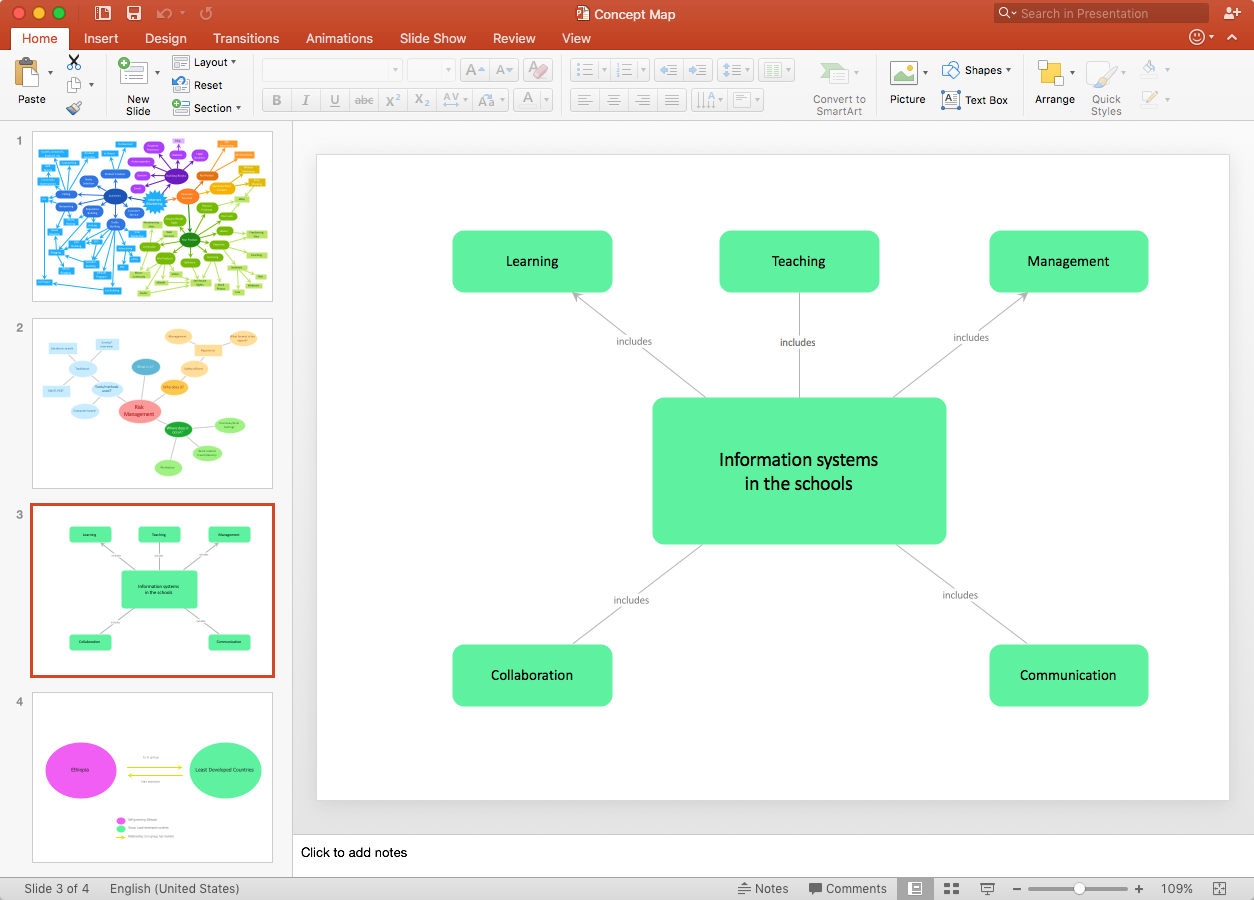
How to Add a Concept Map to a PowerPoint Presentation
Concept maps visually present the relationships among a set of a logically connected items. ConceptDraw PRO allows you to draw concept maps using the Concept Map solution. The PowerPoint presentation of key concept points can be very informative and helpful.How To Make a Concept Map
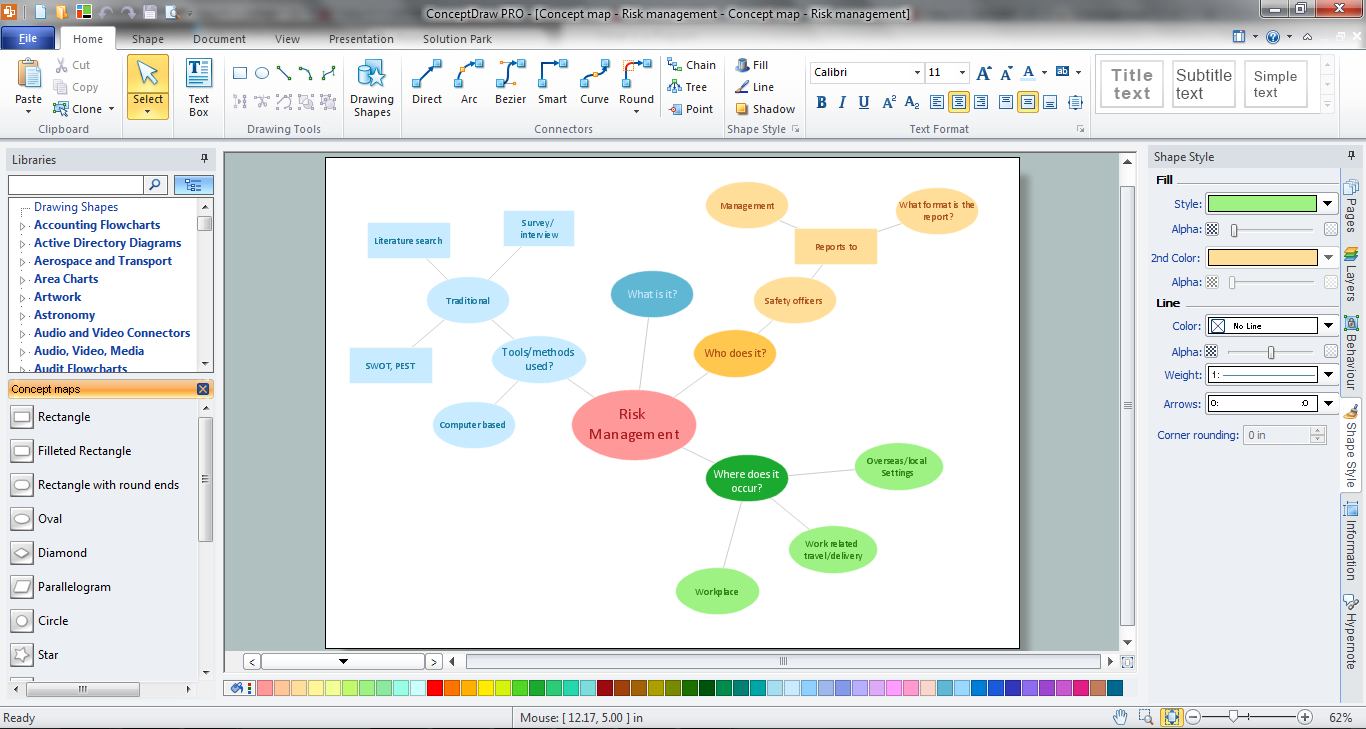
How to make a Concept Map fast and easy? ConceptDraw PRO diagramming and vector drawing software extended with Concept Maps Solution from the "Diagrams" Area is the best choice for those who want design professional looking Concept Map in minutes.HelpDesk
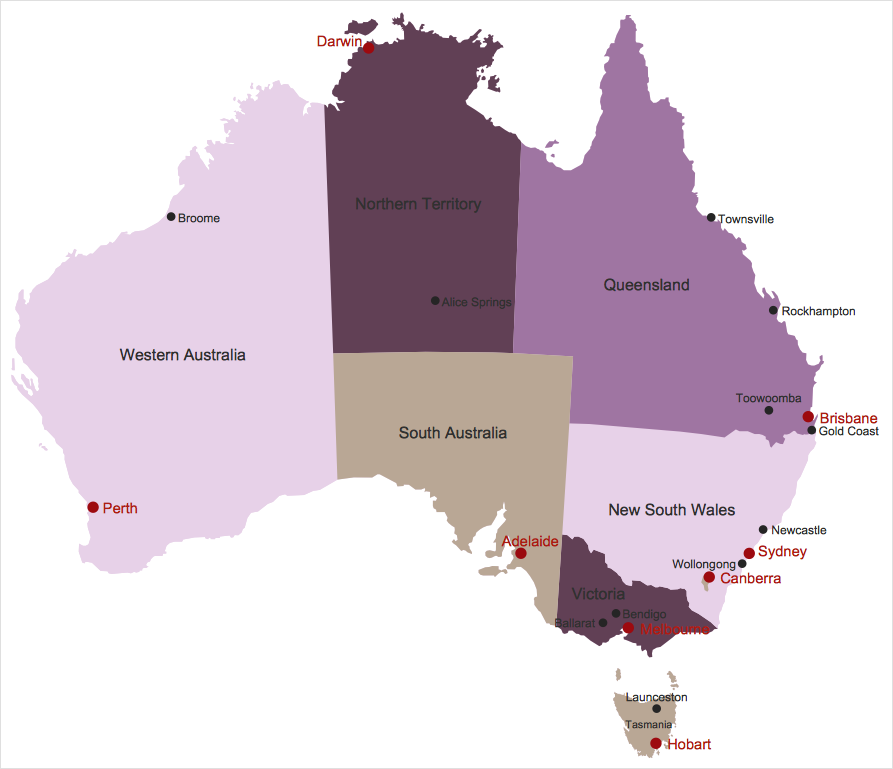
How to Draw Maps of Australia
Australia is the sixth largest country in the world. Australia consists from the mainland which is surrounded by many thousands of small fringing islands and numerous larger ones. The vast territories, aligned with interesting historic features across a wide expanse, make the thematic map an ideal way of depicting geographical, geological and political information related to Australia.The Australia Map solution for ConceptDraw PRO will help you to make the steps of the creativeness easy and intuitive. The Australia Map solution provides templates and samples along with vector stencils to get you started. Used together with other ConceptDraw PRO solutions it will allow you to create comprehensive geography-related infographics.Export from ConceptDraw MINDMAP to PowerPoint® Presentation
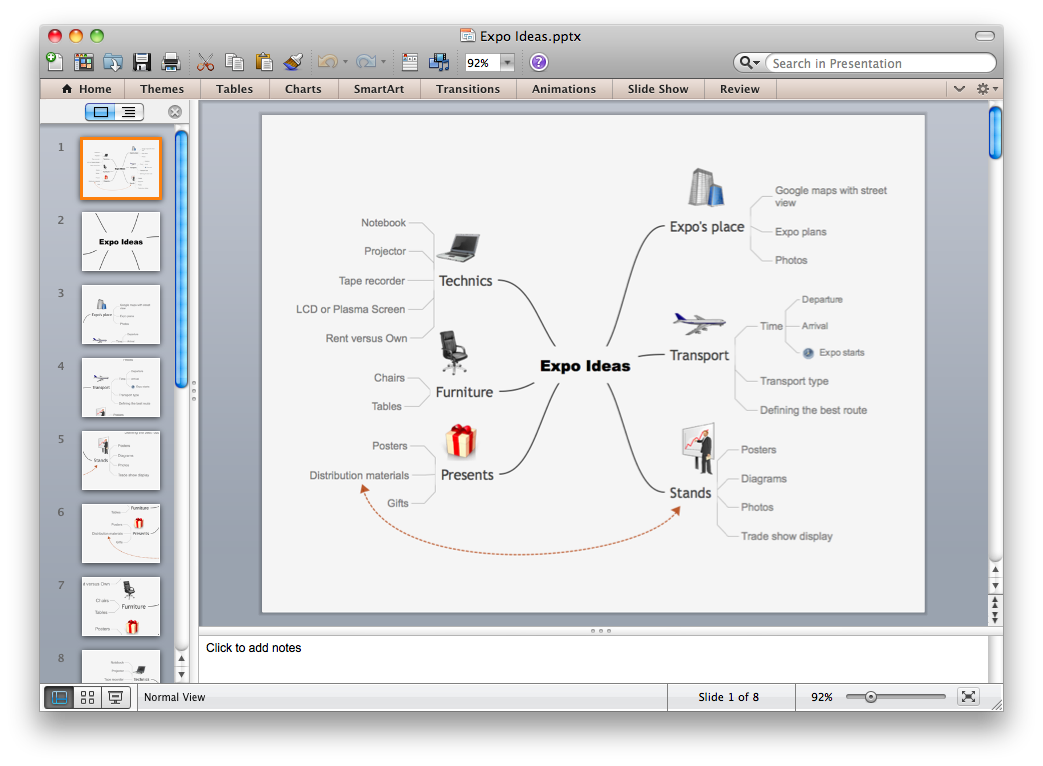
ConceptDraw MINDMAP extended with Presentation Exchange solution allows you to create a traditional PowerPoint Presentation from your mind maps.
to MS PowerPoint
HelpDesk
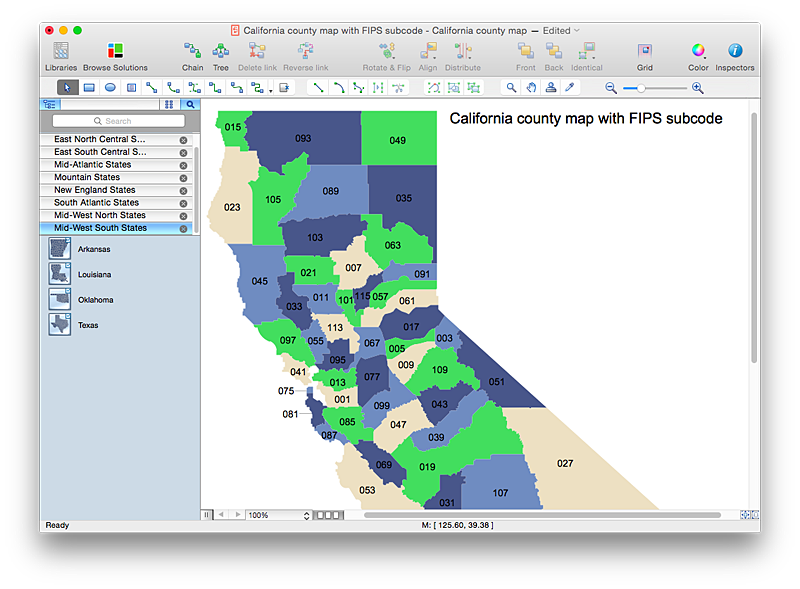
How to Draw a Map of USA States Using ConceptDraw PRO
You can found a huge set of geopolitical statistical data regarding America. A common way of visualizing this data is to create maps that connect a particular data in relation to a specific geographical area. Thematic maps are used to depict such data as population density, average rainfall, or political allegiance, representing the data by using visual elements and annotation. Thematic maps always focus on one particular subject matter unlike general reference maps, which display information on a different subjects — vegetation, topology, roads and highways, etc. The United States Mapping Solution for ConceptDraw PRO includes all of the US States with county outlined borders, from the largest, San Bernardino in California, to the smallest Kalawao County, Hawaii.What is Value Stream Mapping?
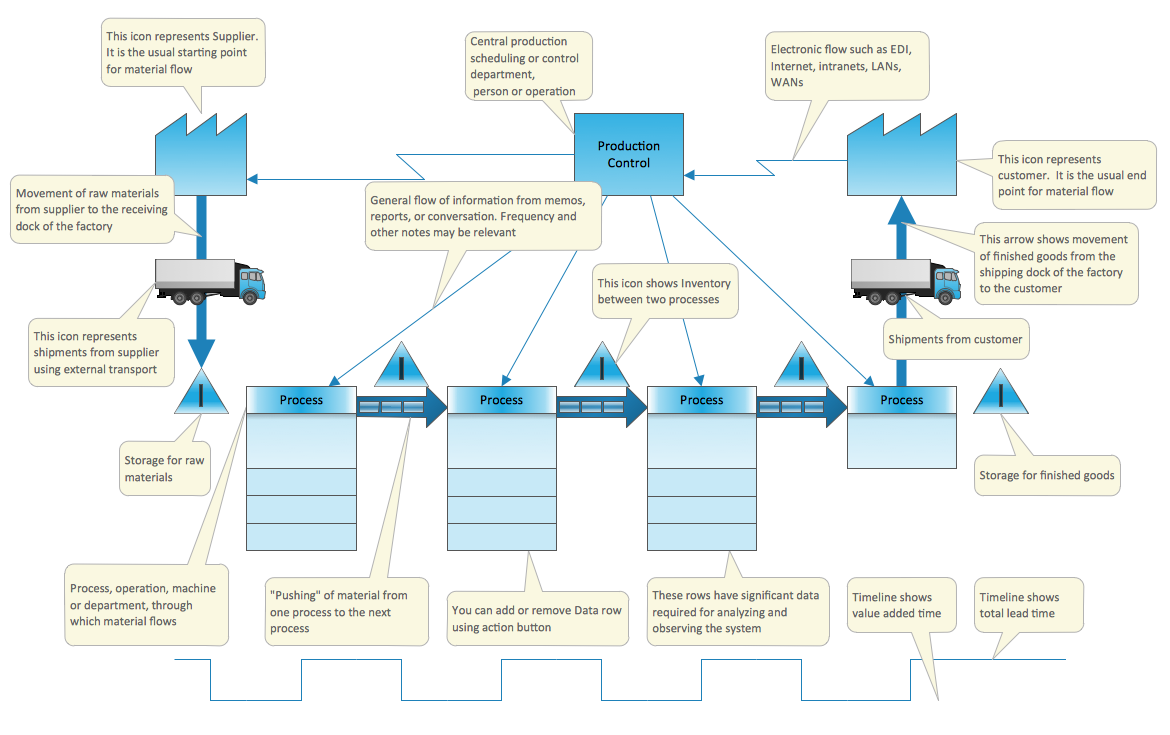
Value stream maps (VSM) are an essential tool for organizations applying Lean methods.Create a Value Stream Map Rapidly
The Value Stream Mapping solution from ConceptDraw Solution Park extends ConceptDraw PRO software with a new library that contains vector objects, samples and templates.HelpDesk
How to Add a Bubble Diagram to PowerPoint Presentation
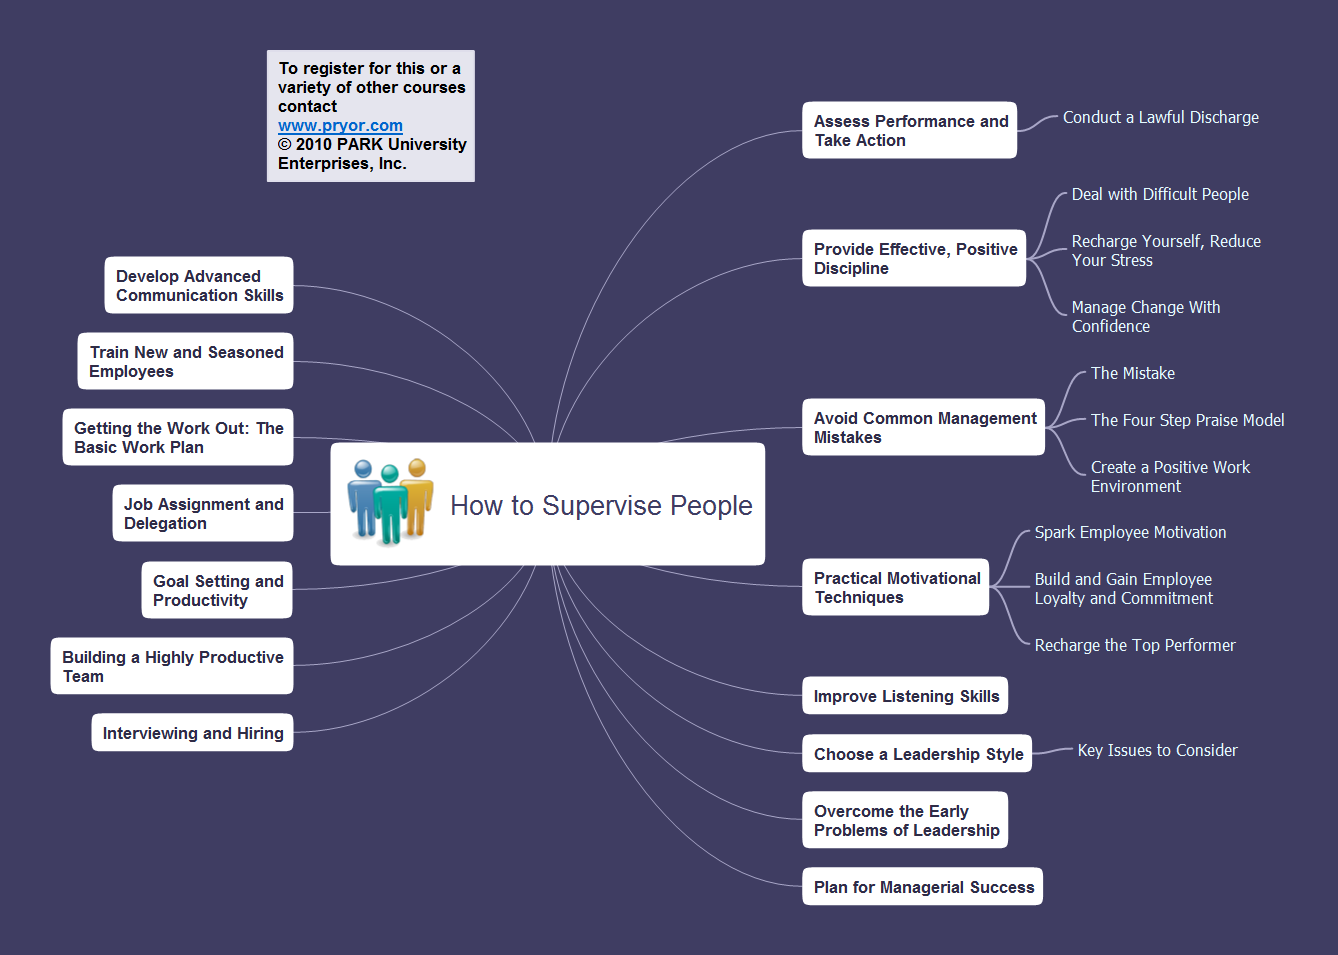
Bubble diagrams can be used to compare concepts, and identify areas of similarity and difference. ConceptDraw PRO allows you to make a MS PowerPoint Presentation from your charts in a few simple steps.Presentation Preparation using Mind Maps
Whenever you need quick presentations, the ability to choose specific content, the ability to focus on specific stakeholder needs, update data, or create polished slide decks — ConceptDraw MINDMAP provides a presentation solution for you.- How To Draw Block Diagram In Microsoft Powerpoint
- How To Draw A Dot Diagram Power Point
- Fishbone Diagram | Fishbone Diagrams | Mind Map Free Download ...
- How To Draw Fishbone Diagram In Powerpoint Mind Map
- How Draw Circular Tube In Powerpoint
- How to Add a Concept Map to a PowerPoint Presentation Using ...
- Powerpoint Graphic Railway Map
- How To Draw A Bock Diagram In Power Point
- Bussiness Process Sample On Ppt
- How to Draw a Mind Map on PC Using ConceptDraw MINDMAP ...

